Using The Session Dashboard
Mind Dump Session Dashboard is an analytics and planning view for a single date-centric session. It summarises open and completed work with KPI cards, charts, and task tables and lets you drill into tasks or jump back to the main app with filters already applied.
This manual page covers how to reach the dashboard from the main app sidebar and global navigation menu, prerequisites, every section of the dashboard, interactive behaviour, and the round-trip workflow between the dashboard.
1. What the Session Dashboard Is
The Session Dashboard answers questions such as:
-
How much work is open, overdue, or due today?
-
How is open work distributed across due-date buckets?
-
How urgent is the remaining workload?
-
How many tasks were completed or postponed in the last 30 days?
-
Which open tasks are scheduled on the calendar vs unscheduled?
-
How much estimated time sits in each due-date bucket?
-
How are custom Dropdown fields populated across open tasks?
It is designed for date-centric sessions — the same session type used by the main task list’s date buckets (Overdue, Due Today, Due Tomorrow, and so on). It is not available for alphabetical sessions, knowledge-base sessions in the session picker, or mixed-session views.
2. Prerequisites
Before the dashboard is useful, you need:
| Requirement | Why it matters |
|---|---|
| Logged-in Mind Dump account | Dashboard data is loaded from the API using your user credentials. |
| At least one date-centric session | Sessions with sort_mode = date appear in the dashboard session list. |
| A selected session (when coming from the sidebar) | The sidebar button only appears when a single date-centric session is active. |
| Not in Mixed Session view | Mixed sessions combine multiple session IDs; the dashboard requires one session at a time. |
Sessions excluded from the dashboard session dropdown:
-
Alphabetical sessions
-
Knowledge-base sessions
3. Accessing the Dashboard from the Main App Sidebar
The primary entry point from the main app is the sidebar in the main app view:
Where to find it
-
Open the main Mind Dump app (
index.html). -
Log in if prompted.
-
In the left sidebar, expand Quick Tools.
-
Click 📊 Session Dashboard.
It lives in the Quick Tools section, alongside Report Builder, Form Builder, and Customise card.
When the button is visible
The Session Dashboard button is hidden by default and only shown when all of the following are true:
-
A session is selected.
-
The current session is date-centric.
-
You are not in Mixed Session view.
When you switch to an alphabetical session, the button is hidden along with the Date Filters sidebar section.
What happens when you click it
Clicking the button calls openSessionDashboard(), which:
-
Verifies that a session is selected.
-
Blocks access if you are in mixed-session mode.
-
Blocks access if the current session is alphabetical.
Sidebar access checklist
| Step | Action |
|---|---|
| 1 | Select a date-centric session from Select Session in the sidebar |
| 2 | Confirm you are not in Mixed Session view |
| 3 | Open Quick Tools |
| 4 | Click 📊 Session Dashboard |
Tip: If you do not see the button, check that you have selected a date-centric session rather than an alphabetical or knowledge-base session, and that Mixed Sessions is not active.
4. Accessing the Dashboard via the Global Menu
Mind Dump includes a Global Navigation Menu.
Opening the global menu
| Method | Where it works | Notes |
|---|---|---|
| Alt+I (Windows/Linux) or Opt+I (Mac) | All pages that load the Global Menu | Toggles the menu open and closed |
| Menu floating button (bottom-left) | All pages except the main view | On the main app front page, only the keyboard shortcut is available — no floating launcher button |
| Escape | While menu is open | Closes the menu |
On the dashboard, the header also reminds you:
Press Alt+I (Opt+I on Mac) or use the Menu button for navigation
Session Dashboard in the menu
The global menu includes Session Dashboard as a navigation item:
-
Label:
(G) Session Dashboard -
Target:
dashboard.html -
Keyboard shortcut (menu open): press G
Quick Sessions section
When logged in, the menu may also show up to three Quick Session shortcuts at the top (keys 1–4):
-
1 — Default Session
-
2–4 — Your configured quick session buttons
These shortcuts return to index.html with a session action; they do not open the dashboard directly. Use G or the Session Dashboard menu item for the dashboard.
Differences: sidebar vs global menu
| Aspect | Sidebar (index.html) | Global menu |
|---|---|---|
| Visibility | Only when a date-centric single session is active | Always listed |
| Session context | Uses currentSessionId from the main app | Uses mindDumpSessionId from session storage |
| Validation before navigation | Yes — errors shown if session invalid | No pre-check; dashboard validates on load |
| Available on dashboard page | No (you are already there) | Yes — use to jump to other views |
5. Session Selection
Choosing which session to analyse
After login, the dashboard header shows:
-
Session name (e.g.
Session Dashboard: Work) -
Session dropdown — switch between your date-centric sessions
-
Refresh button
← Back to Main App link to main app window.
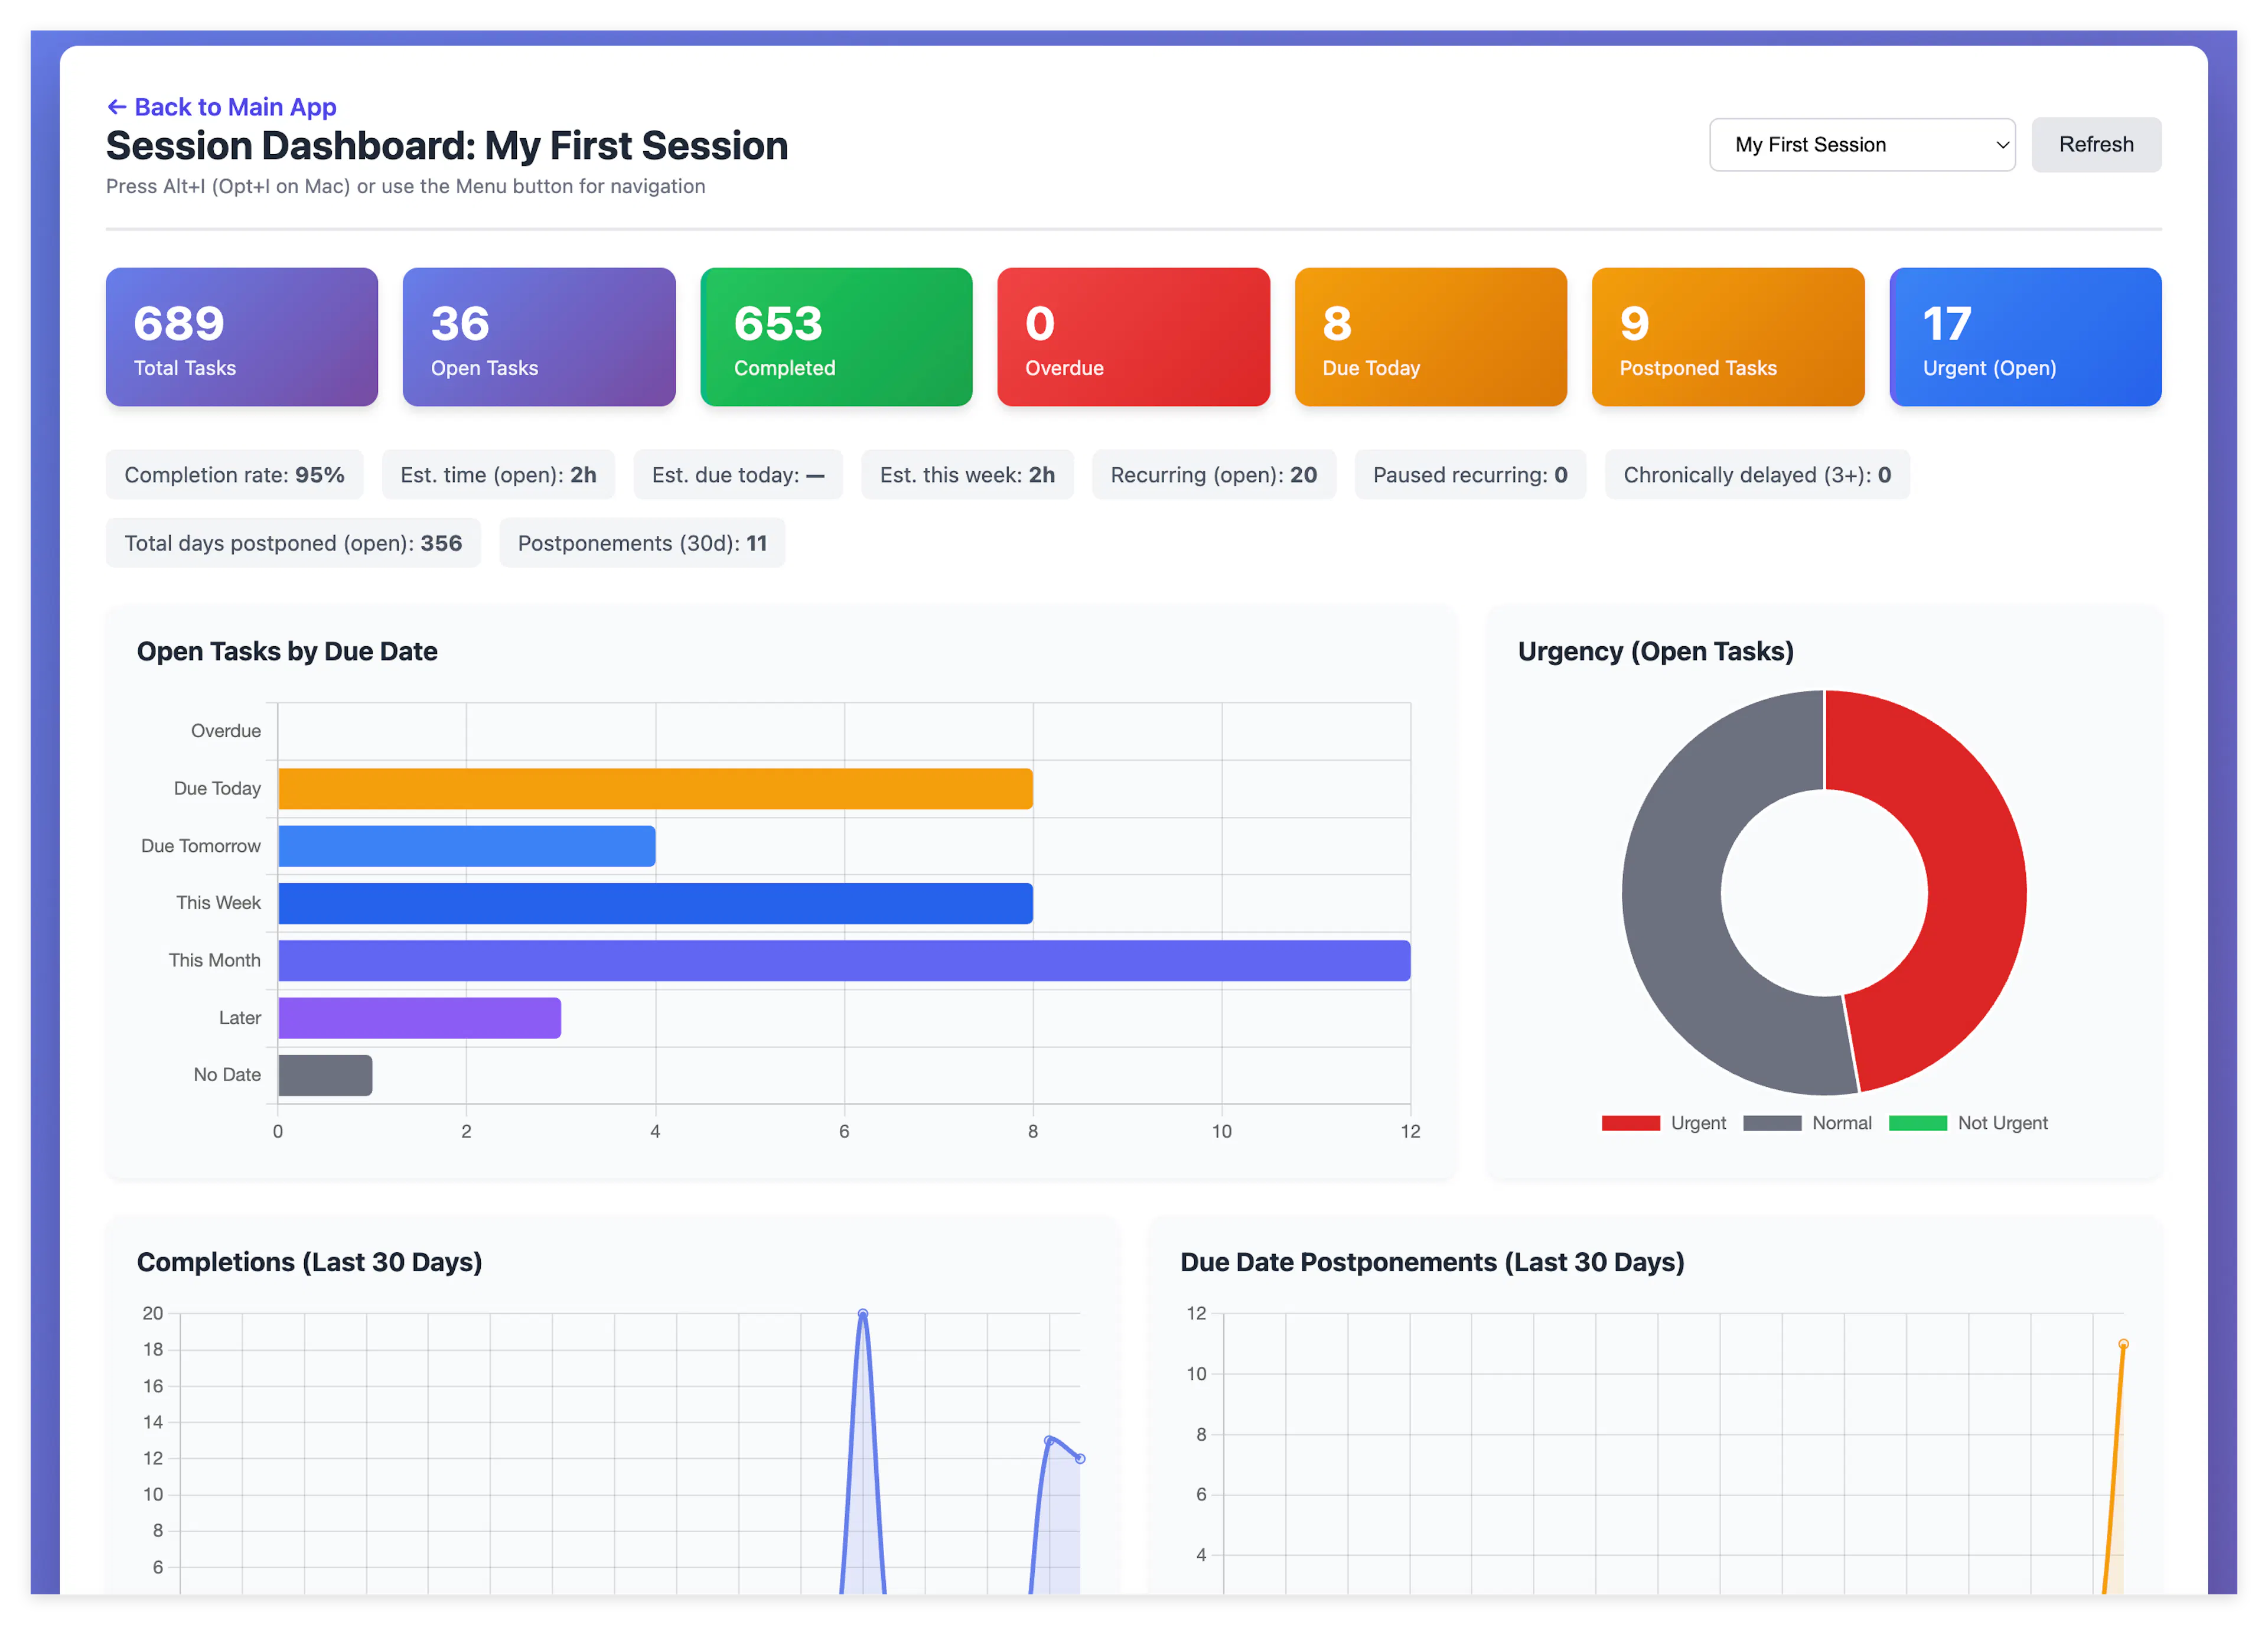
6. Dashboard Layout Overview
Once data has loaded, the page is structured as follows (top to bottom):
-
Header — back link, session name, session selector, refresh
-
KPI stat cards — clickable summary counts
-
Secondary stats bar — rates and aggregate estimates
-
Charts row 1 — Open Tasks by Due Date, Urgency
-
Charts row 2 — Completions (30 days), Due Date Postponements (30 days)
-
Charts row 3 — Scheduled vs Unscheduled, Estimated Time by Bucket
-
Custom Dropdown Fields — one chart per active dropdown custom field (if any)
-
Tables — Due Today, Due Tomorrow, Most Postponed Open Tasks
While loading, a Loading dashboard data... message is shown. Errors appear in a red banner below the header.
7. KPI Cards and Secondary Statistics
KPI cards (clickable)
Each card navigates to a filtered view in the main app when clicked (see Section 11).
| Card | Meaning | Click filter |
|---|---|---|
| Total Tasks | All non-deleted tasks | All tasks |
| Open Tasks | Incomplete, non-deleted tasks | Active tasks |
| Completed | Completed tasks | Completed tasks |
| Overdue | Open tasks with due date before today | Overdue |
| Due Today | Open tasks due today | Due today |
| Postponed Tasks | Open tasks postponed at least once | Postponed |
| Urgent (Open) | Open tasks marked urgent | Urgency = Urgent |
Secondary statistics (informational)
Displayed as a horizontal summary bar:
| Statistic | Description |
|---|---|
| Completion rate | Completed ÷ (open + completed), as a percentage |
| Est. time (open) | Sum of estimated minutes for all open tasks |
| Est. due today | Sum of estimates for tasks due today |
| Est. this week | Sum for today + tomorrow + this-week buckets |
| Recurring (open) | Open tasks flagged as recurring |
| Paused recurring | Open recurring tasks that are paused |
| Chronically delayed (3+) | Open tasks postponed 3 or more times |
| Total days postponed (open) | Sum of cumulative days slipped across open tasks |
| Postponements (30d) | Count of due-date changes in the last 30 days |
Date buckets use your timezone from Settings (get_settings API).
8. Charts
Most charts show a tooltip footer: “Click to filter in main app”.
Open Tasks by Due Date
Horizontal bar chart of open tasks by due-date bucket:
| Bucket | Label |
|---|---|
| overdue | Overdue |
| today | Due Today |
| tomorrow | Due Tomorrow |
| week | This Week |
| month | This Month |
| later | Later |
| nodate | No Date |
Click a bar → opens the main view with filtered to that date bucket.
Urgency (Open Tasks)
Doughnut chart: Urgent, Normal, Not Urgent (open tasks only).
Click a segment → opens the main app with an urgency custom filter applied.
Completions (Last 30 Days)
Line chart of tasks completed per day.
Click the chart → opens completed tasks in the main app.
Due Date Postponements (Last 30 Days)
Line chart of how many due-date changes occurred per day (from session history API).
Click the chart → opens postponed tasks in the main app.
Scheduled vs Unscheduled (Open Tasks)
Bar chart comparing open tasks that have a calendar schedule vs those that do not.
Click a bar → expands an inline drill-down table on the dashboard (does not leave the page).
The drill-down shows:
-
Task text, urgency, estimated time, scheduled date/time
-
View in main app — opens filtered scheduled or unscheduled list
-
Close — collapses the drill-down
Scheduled times respect your user timezone. Tasks with missed schedule status may show (missed).
Estimated Time by Bucket
Horizontal bar chart of total estimated minutes per open-task due-date bucket.
Click a bar → same date-bucket filter as the Open Tasks chart.
Tooltip labels show human-readable durations (e.g. 1h 30m).
Custom Dropdown Fields
If the session has one or more active Dropdown custom fields, an extra section appears:
Custom Dropdown Fields (click a bar to filter in main app)
One horizontal bar chart per field, counting open tasks per option (including (Not set) for empty values).
Click a bar → opens the main app with a custom-field filter for that option.
9. Task Tables
Three tables list specific open tasks. Click any row to open the task editor modal on the dashboard.
Tasks Due Today
Open tasks in the today bucket. Columns: Task, Urgency, Est. Time, Scheduled.
Tasks Due Tomorrow
Open tasks in the tomorrow bucket. Same columns.
Most Postponed Open Tasks
Up to 10 open tasks with the highest postpone counts. Columns:
| Column | Meaning |
|---|---|
| Task | Task text |
| Postponements | Number of times the due date was changed |
| Days Slipped | Total cumulative days postponed |
| Last Changed | Date of last due-date change |
| Scheduled | Next scheduled calendar slot, if any |
10. Editing Tasks from the Dashboard
The dashboard embeds the same Universal Task Edit Modal used throughout the app.
-
Click a task row in any table, or a task in the schedule drill-down.
-
The modal opens.
-
After you save changes, the dashboard automatically refreshes.
If the editor cannot load, an error banner explains the problem.
11. Drilling Through to the Main App
Many dashboard elements are navigation shortcuts. When you click them, Mind Dump drills down to the relevant session data and runs and applies the filter. A banner appears at the top of the task list, for example:
-
Dashboard filter: Due today -
Dashboard filter: Urgency: Urgent -
Dashboard filter: Status: Active
12. Returning to the Dashboard
Back link
Click ← Back to Main App in the dashboard header to return to index.html without clearing filters on the main app.
Clear filters and return
When you arrived from the dashboard, the main app filter banner shows:
✕ Clear filters & return to dashboard
Clicking it:
-
Clears all unified filters and search
-
Removes
returnToDashboardOnClearFilterfrom session storage -
Navigates back to
dashboard.html?session_id=<sessionId>
This gives you a clean round-trip: dashboard → filtered main app → dashboard.
From the global menu
While on index.html with a filtered dashboard view, press Alt+I / Opt+I, then G to reopen the dashboard for the stored session.
13. Refresh and Auto-Update Behaviour
| Action | Behaviour |
|---|---|
| Refresh button | Reloads all dashboard data for the current session |
| Switch session dropdown | Changes session and reloads data |
| Browser tab focus | When you return to the dashboard tab, data refreshes automatically |
| Save task in modal | Dashboard refreshes after save |
14. Limitations and Error Messages
Not supported
| Scenario | What happens |
|---|---|
| Mixed Session view | Redirect to the main app with message: Session Dashboard requires a single date-centric session. Mixed session view is not supported. |
| Alphabetical session | Sidebar button hidden; direct access shows: Session Dashboard is only available for date-centric sessions. |
| No date-centric sessions | No date-centric sessions found. Create a date-centric session in the main app first. |
| Knowledge-base session | Excluded from session dropdown |
Common user-facing errors
| Message | Typical cause |
|---|---|
| Please select a session first. | Sidebar button clicked with no session selected |
| Session Dashboard requires a single date-centric session. | Mixed session mode active |
| Login failed: … | Invalid credentials |
| Could not open task editor | Modal component failed to load |
15. Quick Reference
Open the dashboard
| From | Steps |
|---|---|
| Main app sidebar | Select date-centric session → Quick Tools → 📊 Session Dashboard |
| Global menu (any page except index UI button) | Alt+I / Opt+I → G or click Session Dashboard |
| Global menu on from the main app. | Alt+I / Opt+I → G (no floating Menu button on front page) |
Interact
| Element | Action |
|---|---|
| KPI card | Filter in main app |
| Chart bar/segment (most charts) | Filter in main app |
| Schedule chart bar | Inline drill-down on dashboard |
| Table row | Edit task in modal |
| Session dropdown | Switch analysed session |
| Refresh | Reload metrics |
Return path
| From main app | Action |
|---|---|
| Filter banner | Clear filters & return to dashboard |
| Dashboard header | ← Back to Main App |