Mind Dump Mind Mapping
Introduction to the Mind Map Feature
The Mind Map feature in the Mind Dump Task Manager transforms your traditional task lists into a highly interactive, visual workspace. Designed to give you a spatial understanding of your projects, this view allows you to step back and see the big picture while retaining full control over individual task details, priorities, and deadlines. NOTE: If you are new to Mind Mapping please read the Core Concept document onMind Map
Flexible Layouts and Grouping You can tailor the structure of your visual canvas to perfectly suit your specific workflow. The mind map supports two primary structural layouts: a central Bidirectional map that expands outward, or a top-down Org Chart layout. Furthermore, you can dynamically group your nodes based on your current needs, such as organising by Due Dates, sorting by Custom Fields, or viewing them strictly as an Ungrouped Hierarchy.
Intuitive Drag-and-Drop Organisation Organising your tasks visually is as simple as clicking and dragging. You can grab task nodes to freely reposition them, create new subtasks, or drop them directly into different date categories and priority groups to instantly update their underlying data.
Custom Relationships and Text Boxes Beyond standard parent-child task hierarchies, the Mind Map allows you to draw custom links between any two items on the canvas. These arbitrary links can be labeled with specific relationships such as "Relates to," "Depends on," or "Blocks," complete with directional arrows. To further enrich your map, you can add independent Free Text Boxes anywhere on the canvas. These text boxes can serve as standalone floating notes, be converted into large icon-only markers, or be linked directly to your tasks to provide extra context.
Deep Visual Customisation Mind Dump allows you to personalise your workspace heavily. You can customise the Canvas Background Colour, apply distinct Branch Colours to differentiate project streams, and individually format the text and background colours of your floating text boxes. You can also adjust the physical geometry of your map by selecting between Curved, Straight, or Elbow branch styles, and manually tweaking the curve tension and vertical separation of the connections.
Navigation, Filtering, and Exporting Navigating large and complex projects is made easy with an infinite, zoomable canvas and a dedicated Mini-map that highlights your current viewport. When you need to drill down into specific data, you can utilise the powerful filtering system to search by keyword, isolate tasks by urgency (Urgent, Normal, Low), filter by date ranges, or create compound custom filter rules. Once your mind map is perfectly organised, you can easily share your work by exporting the canvas to a PDF document or copying the structure as an OPML outline.
Understanding Session Modes: Date-Centric vs. Alphabetical Mind Maps
Mind Dump’s Mind Map view is highly dynamic, automatically adapting its structural layout, user interface, and interactive behaviours based on the underlying nature of your session (its "sort mode"). The app divides sessions into two primary categories: Date-centric and Alphabetical (often referred to as Alpha, Knowledge Base, or Outline sessions).
Here is a breakdown of the basic differences and why these two modes exist:
Date-Centric Session Mind Maps Why it exists: This mode is engineered for strict task execution, time management, and triage. It is designed to answer the question, "What do I need to do next?"
-
Time-Based Structure: By default, the mind map organises your data by Due Dates. The primary branches extending from your central session node are fixed time categories, such as "Overdue," "Due Today," "This Week," "This Month," and "Later".
-
Urgency Sub-grouping: Within those specific date branches, tasks are automatically subdivided into priority groups: Urgent, Normal, and Not Urgent.
-
Tailored Interface: Because time and priorities dictate the structure, the UI displays a colour-coded legend for your deadlines and provides a specific toggle to turn priority grouping on or off.
Alphabetical (Alpha/Hierarchy) Session Mind Maps Why it exists: This mode is built for knowledge management, outlining, and brainstorming. It strips away time-based constraints to let you build a free-form knowledge graph where the logical, parent-child relationships between items are the only things that matter.
-
Pure Hierarchical Structure: In Alpha mode, tasks are not forced into date or urgency buckets. Instead, your primary "root tasks" connect directly to the central session node, forming a pure structural hierarchy.
-
Streamlined Interface: Because due dates and urgency levels do not dictate the layout, the date-grouping dropdown option, the priority grouping toggle, and the time-based legend are completely hidden from the interface.
-
Spatial Reordering: Alpha mode unlocks a drag-and-drop capability called Root Task Repositioning. You can drag primary branches and drop them into specific "insertion gaps" to permanently reorder your visual layout on the canvas.
-
Performance Scaling: Because Alpha sessions allow for an unconstrained, free-form canvas, they can become visually complex. If you attempt to load an Alpha session with more than 30 primary parent tasks, the app will present a warning, as rendering massive free-form maps can become unwieldy and impact browser performance.
In Summary: The core difference lies in how the canvas controls your data. Date-centric maps impose a rigid, automated framework (Time -> Priority) to help you manage a schedule. Alphabetical maps remove those constraints, giving you the freedom to manually build, order, and structure complex trees of information.
Navigating the Canvas: Panning and Zooming
As your mind map grows, you will need to move around the workspace. Mind Dump offers a smooth, infinite canvas that you can navigate using standard mouse and trackpad gestures, or via dedicated on-screen controls.
Using Mouse and Trackpad Actions You can freely explore your mind map using intuitive gestures:
-
Panning: To move across the canvas, simply click and hold on any empty background area and drag your mouse. If you are using a trackpad, you can use the standard two-finger swipe gesture to pan in any direction. Note: The panning action is intentionally disabled if you click and drag directly on a task node, as this interaction is reserved for dragging and dropping tasks.
-
Zooming: To zoom in and out of the map, use your mouse's scroll wheel or perform a pinch-to-zoom gesture on your trackpad.
Whenever you start panning or zooming, any open task menus or quick action buttons will automatically close so they do not obstruct your view.
On-Screen Zoom Controls If you prefer clicking to navigate, you can use the dedicated zoom control panel pinned to the bottom-right corner of the mind map.
-
Click the "+" (plus) button to step your zoom inward.
-
Click the "−" (minus) button to step your zoom outward.
Centralising the Map When working with complex projects, it is easy to lose your place on the infinite canvas. Mind Dump provides two dedicated tools to instantly bring your entire project back into view:
-
Centre & Zoom (Top Menu): Located in the main input menu at the top of the screen, the Centre & Zoom button calculates the physical boundaries of your entire mind map structure. Clicking it will instantly centre the camera on the exact middle of your map and adjust the zoom level so that all content fits on the screen.
-
Zoom to Fit (Bottom Right Controls): Located next to the plus and minus buttons in the bottom right corner, you will find the Zoom to Fit button (represented by a ⊡ square icon). Clicking this button calculates the boundaries of all currently visible nodes—smartly ignoring any nodes that are currently hidden or dimmed by your active search filters. It then performs a smooth, sweeping camera transition to perfectly frame and centre your visible tasks within the window, leaving a comfortable padding around the edges.
Mind Map Canvas Colour
To change the background colour of your mind map canvas, follow these steps:
-
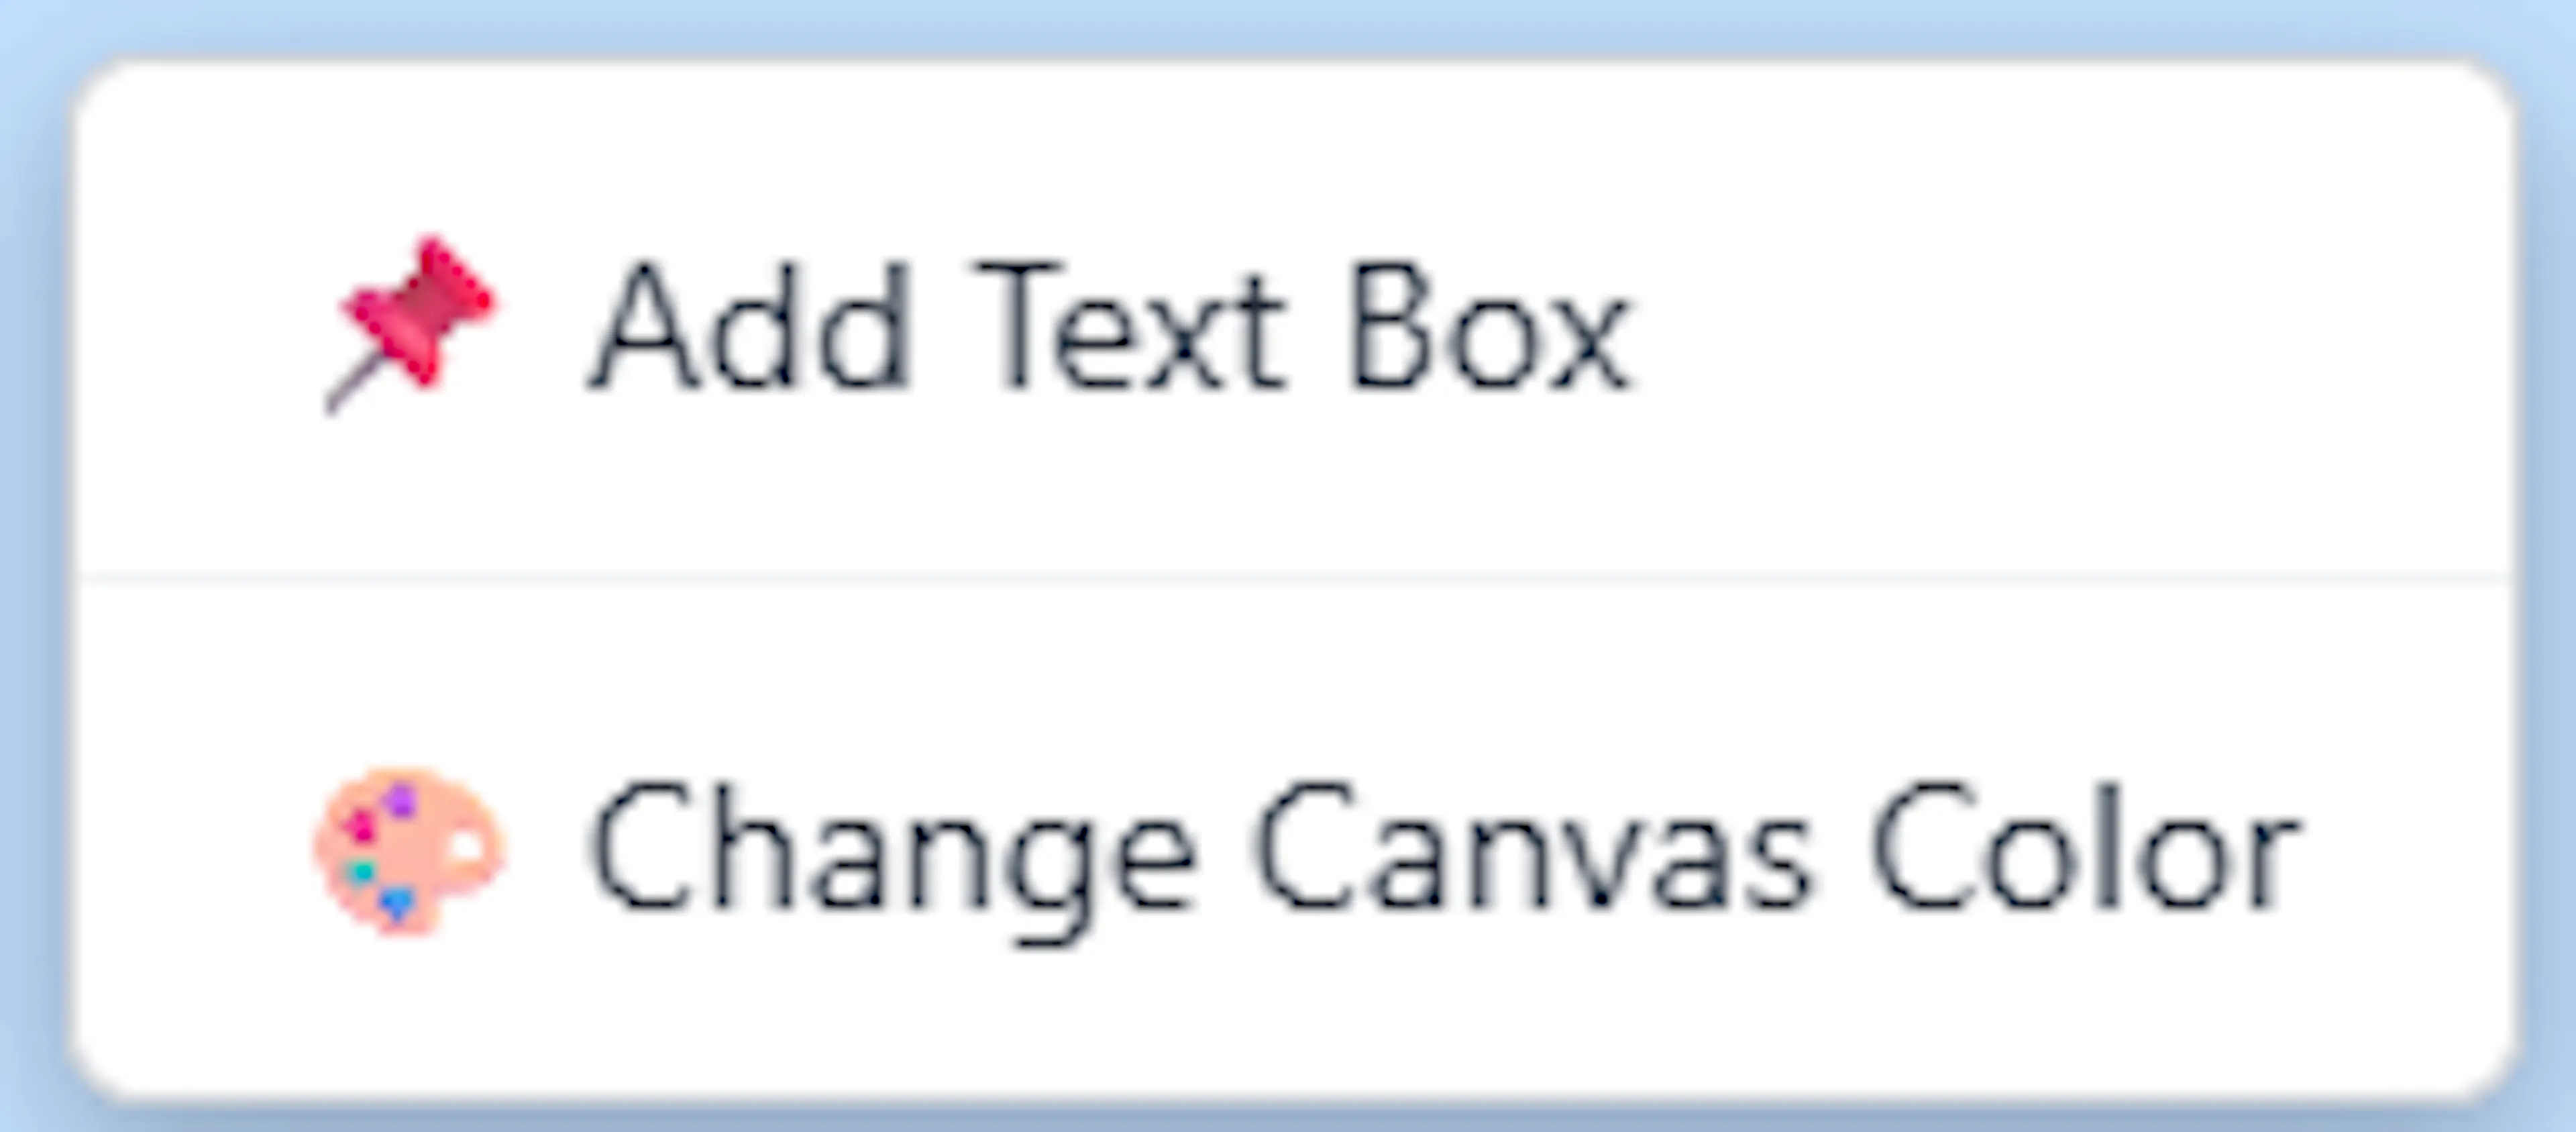
Right-click on an empty area of the canvas, ensuring you do not click directly on a task node or text box.
-
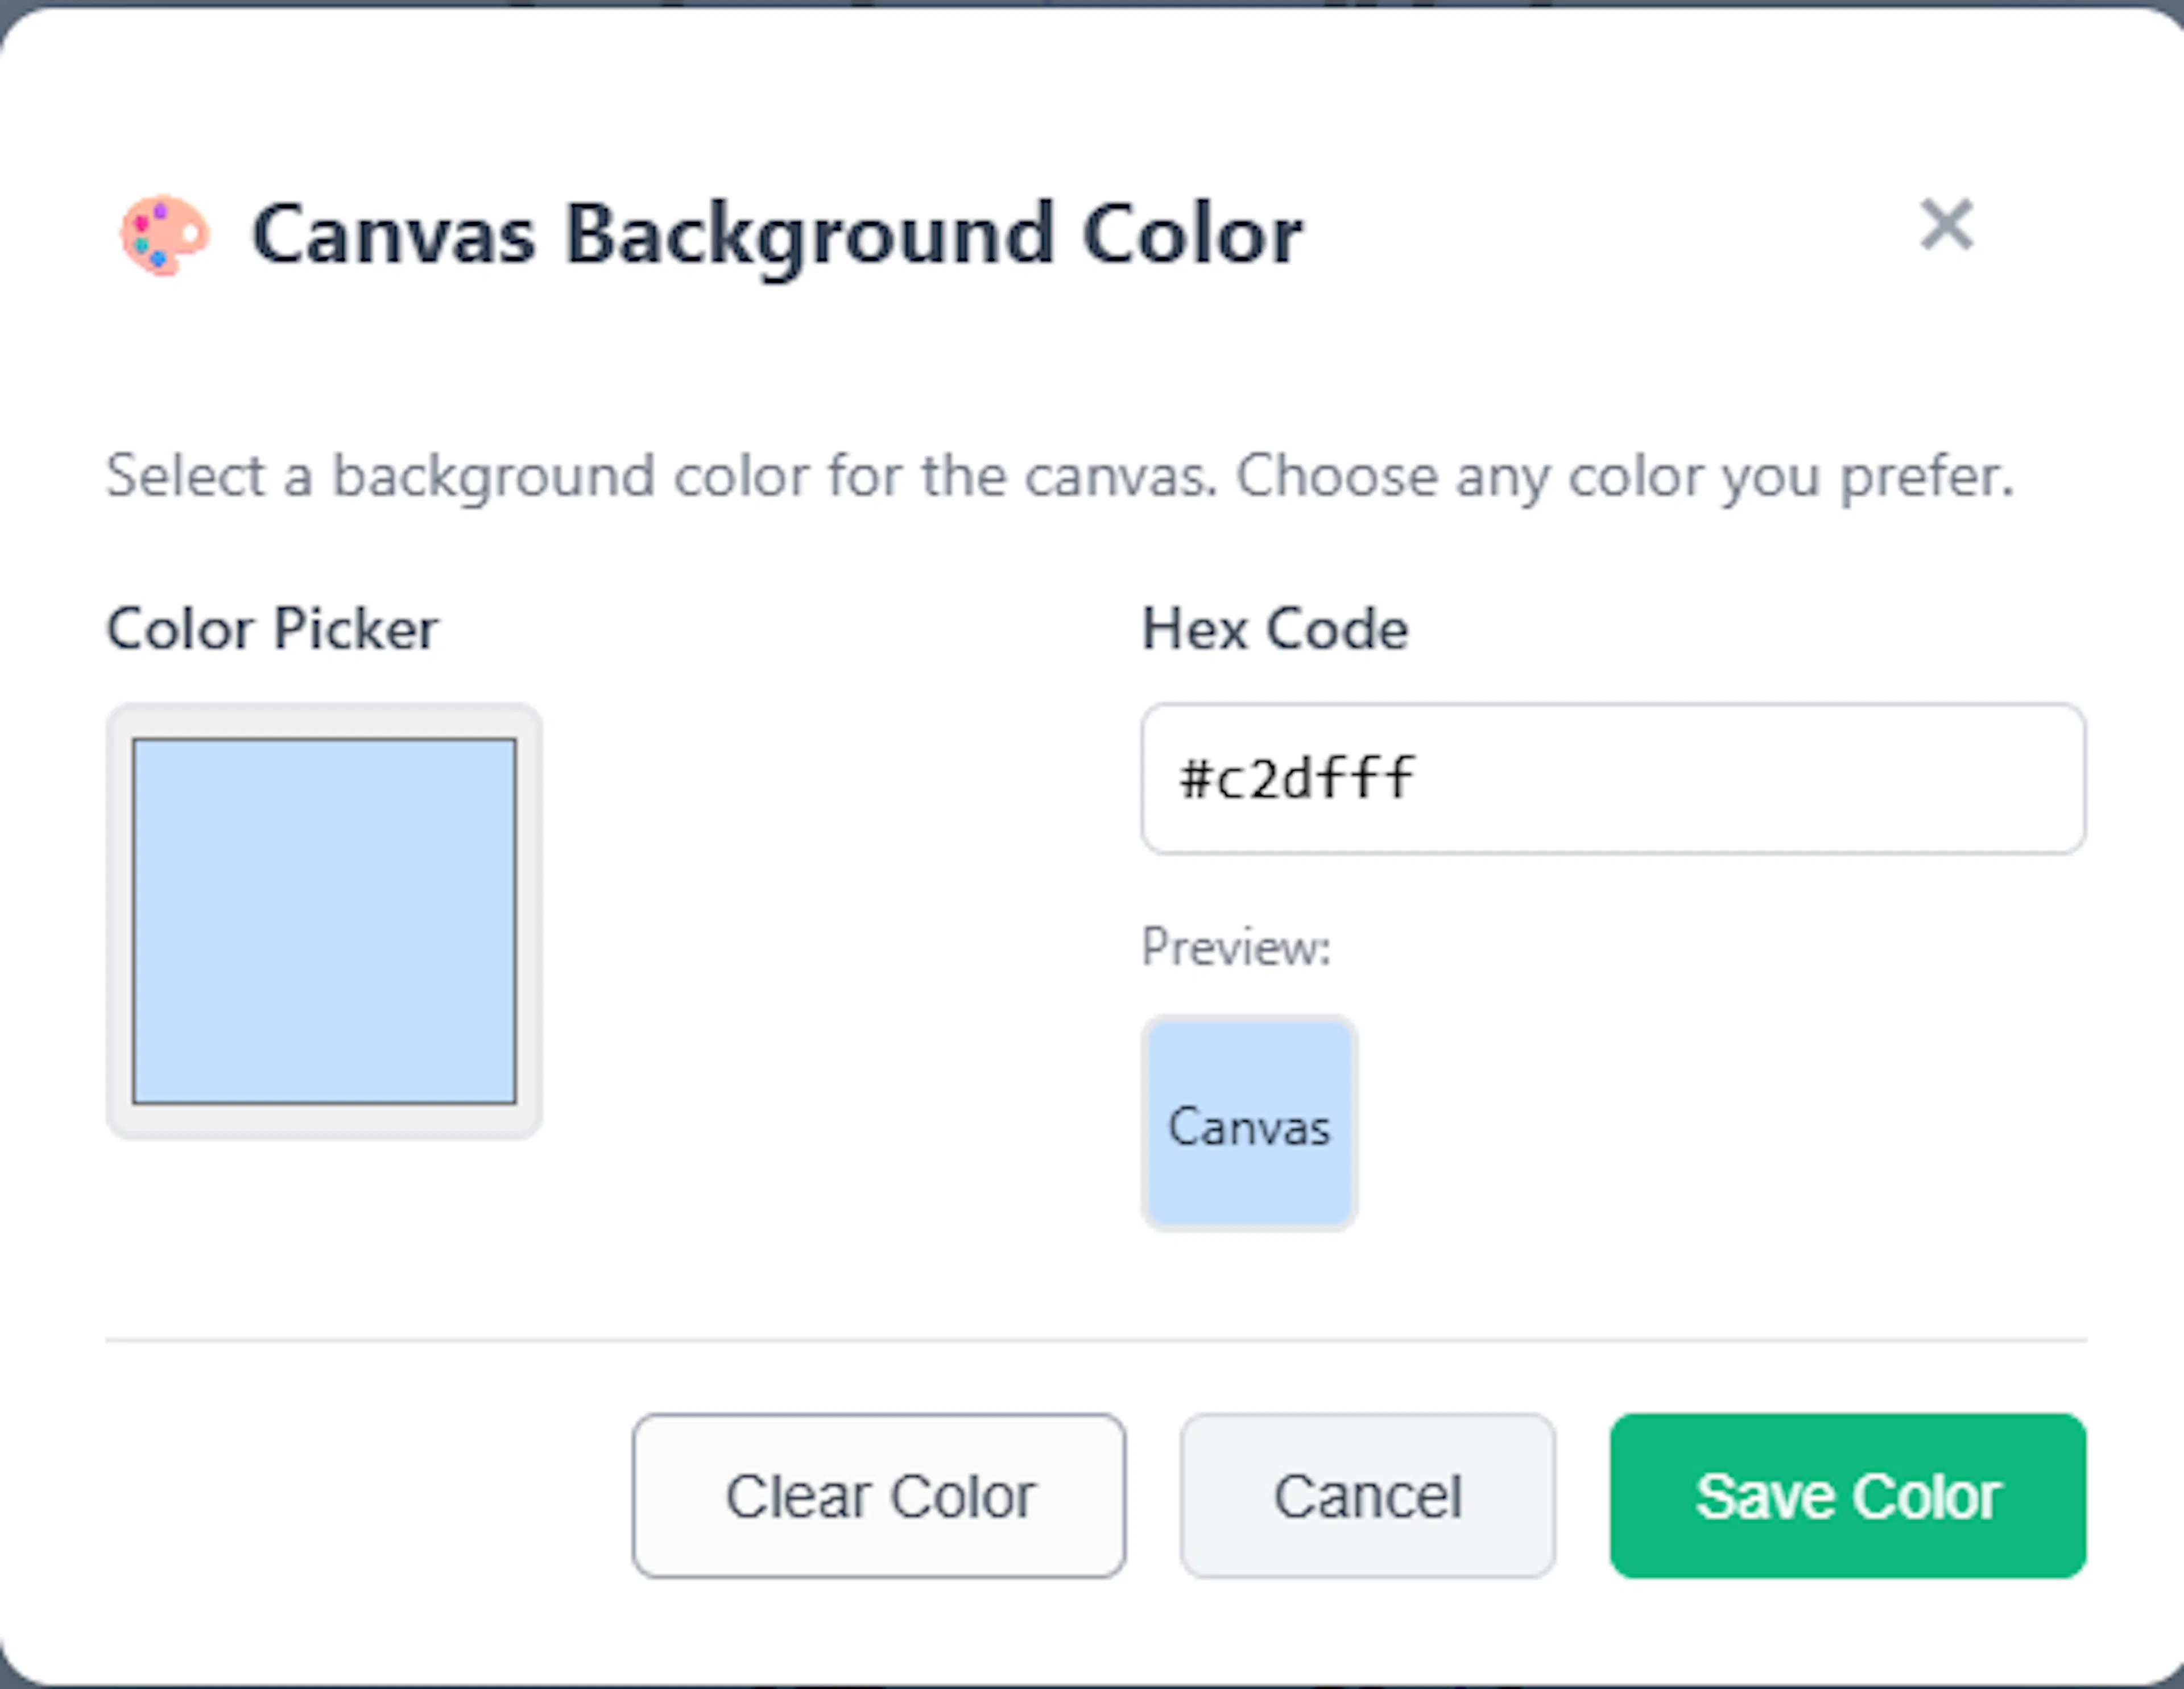
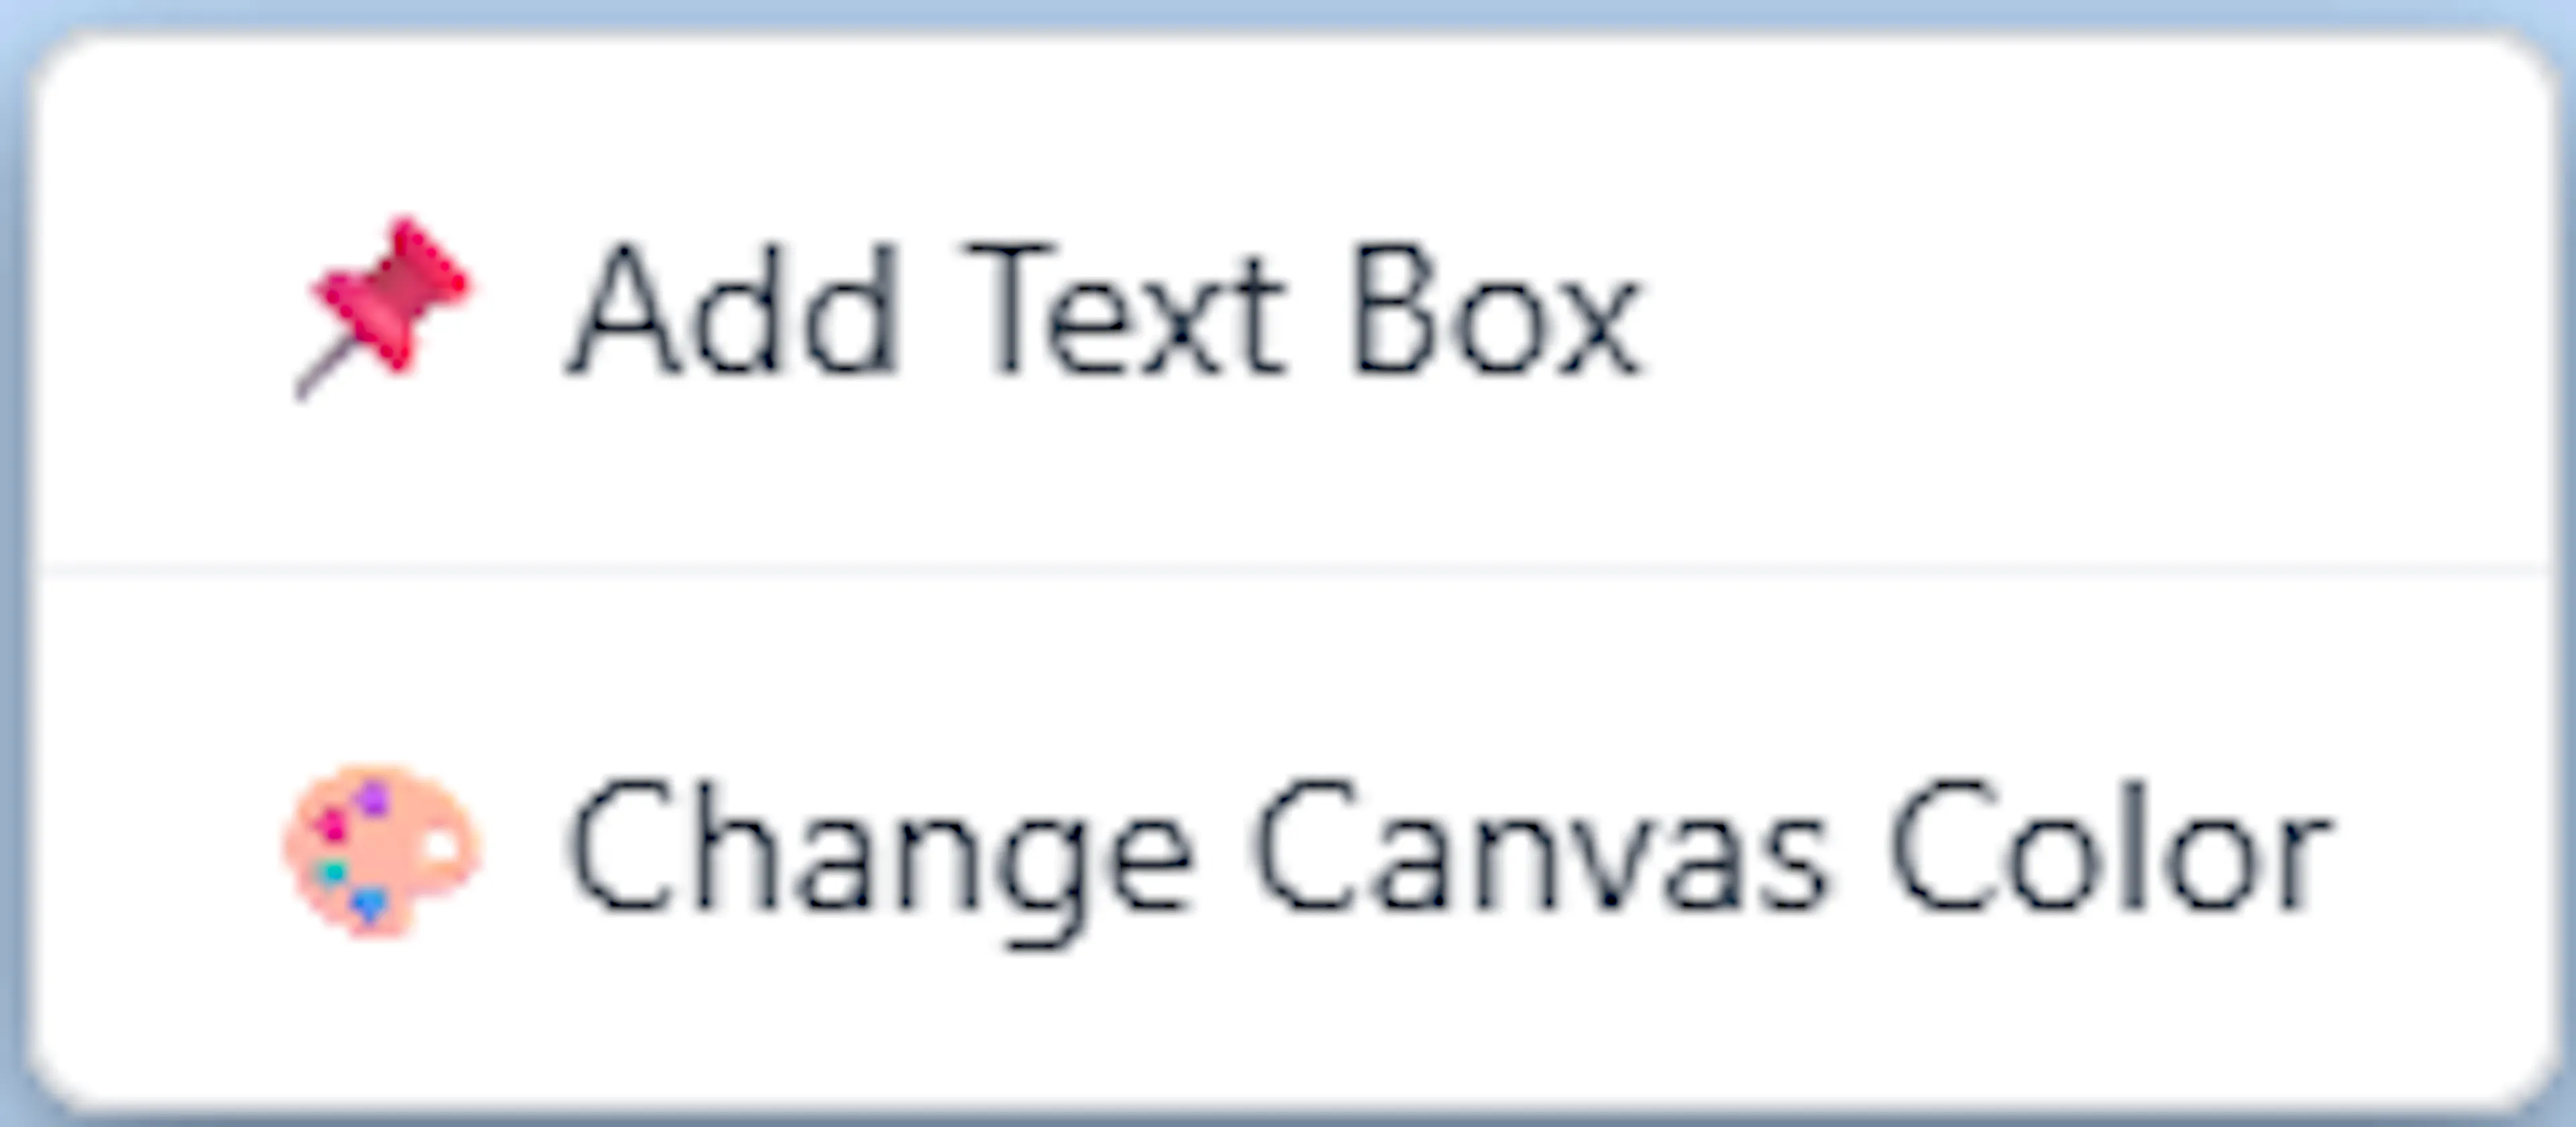
Select "Change Canvas Colour" from the context menu. This will open the modal for the canvas background colour.
-
Choose your preferred background colour by using the visual colour picker input, entering a specific Hex Code, or selecting from a grid of your recently used colours.
-
Click 'Save Colour' to apply the new background to your workspace.
If you ever want to reset the canvas to its default white background, you can open this same modal and click the 'Clear Colour' button.
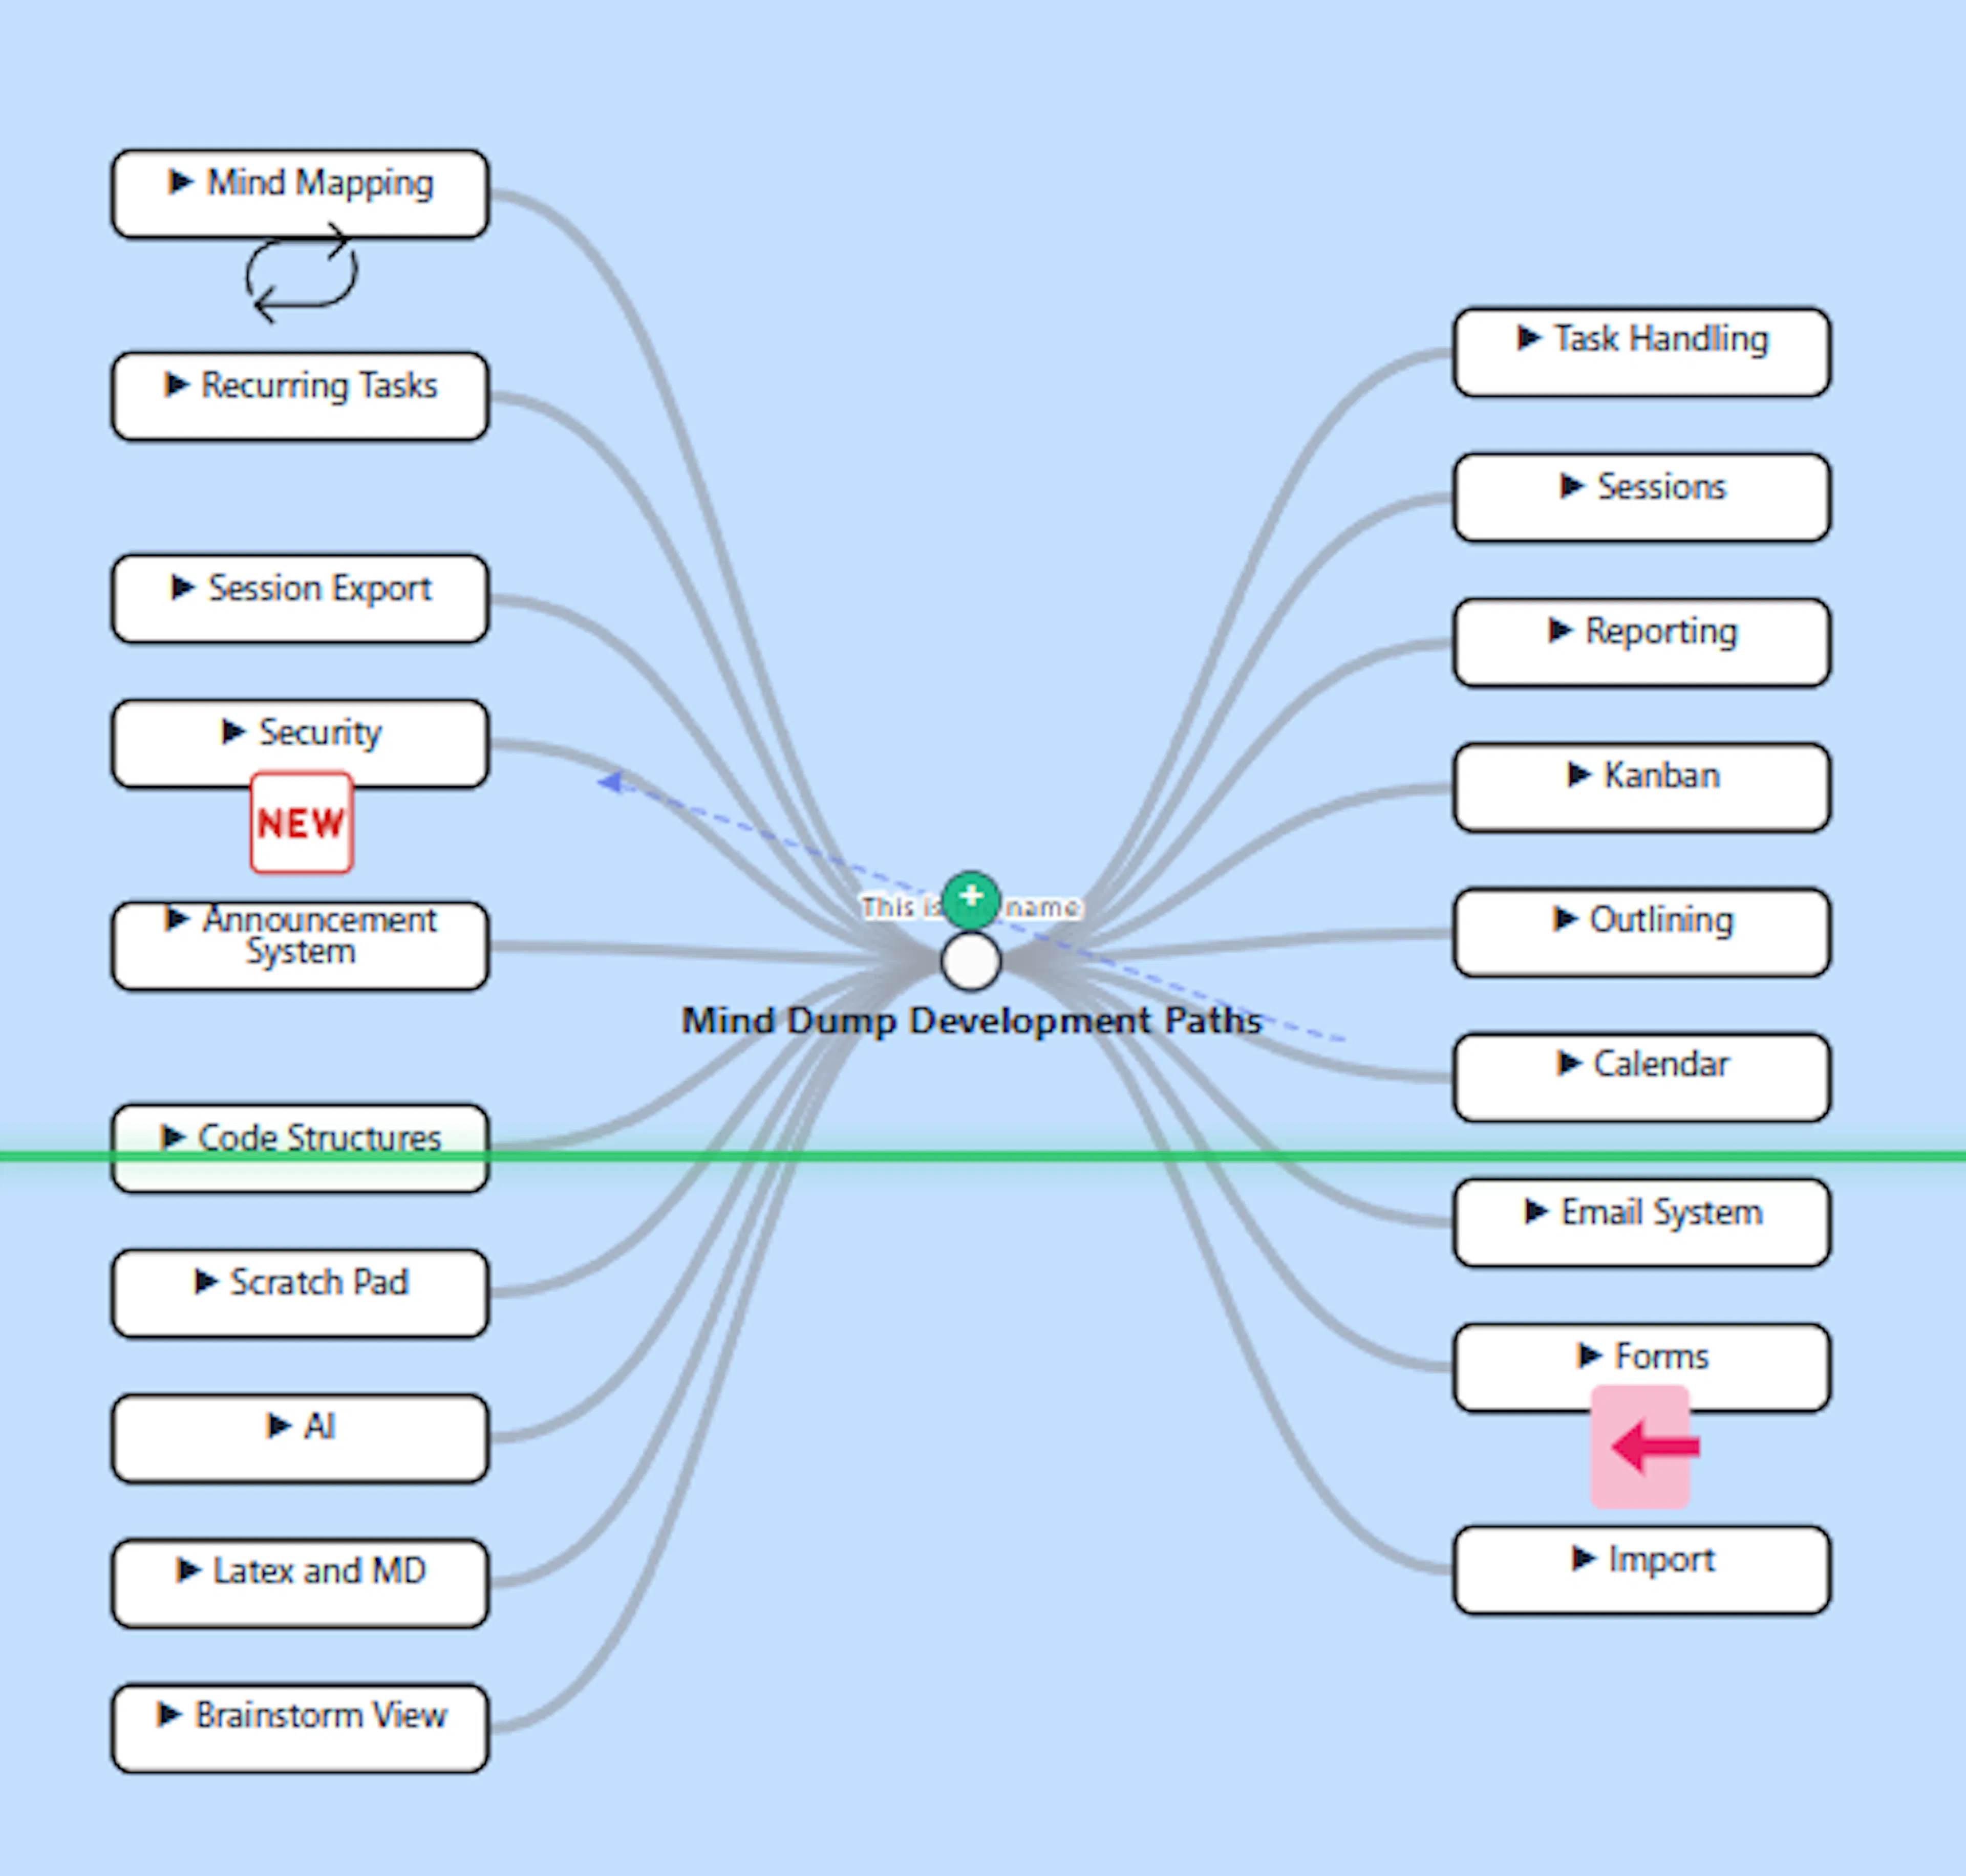
The Central Node: Your Mind Map's Foundation
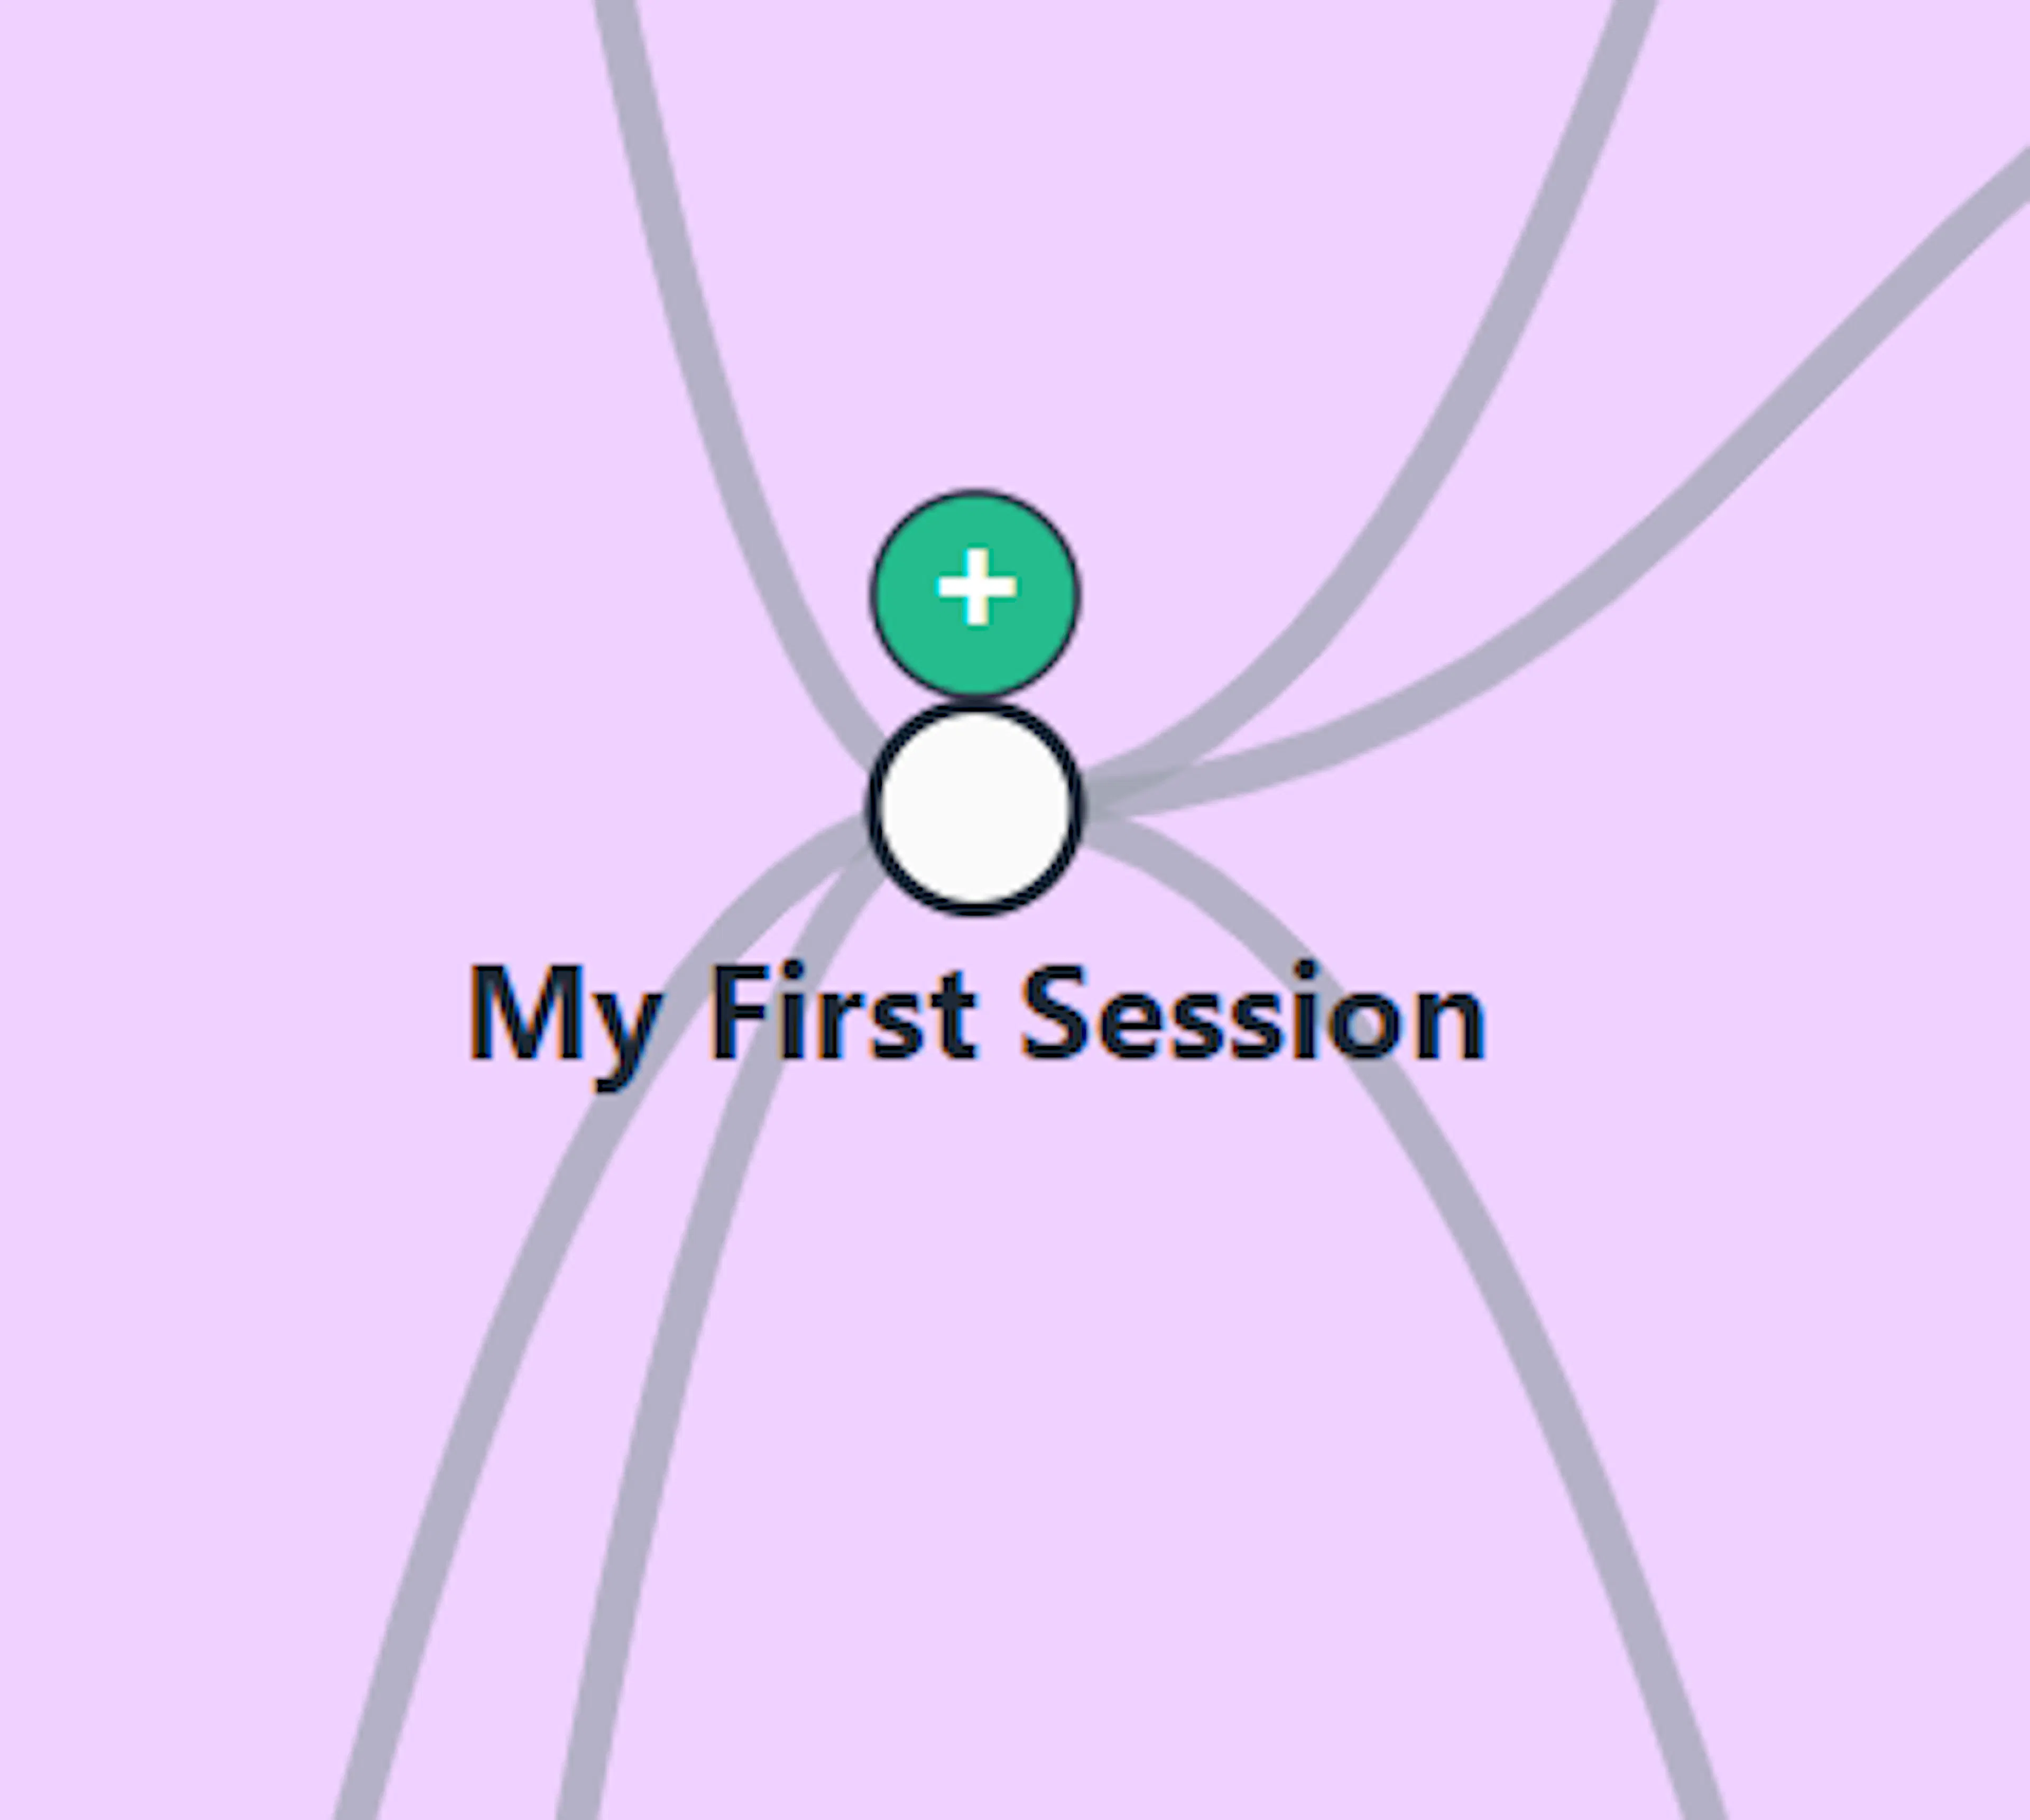
The central node—prominently displaying your session or project name—acts as the foundational anchor for your entire workspace. Everything you map out will branch outward or downward from this singular origin point.
Starting Your Mind Map
To begin building your mind map, you need to create your first "root tasks"—the primary branches that connect directly to the central node. Mind Dump offers two seamless ways to initiate this from the central node:
-
Using the Mouse: Locate the small, green circular "+" (plus) button positioned directly next to the central node. Clicking this button will immediately open the task creation form.
-
Using the Keyboard: Click directly on the central node to select it. Once selected, press the Tab key on your keyboard to instantly trigger the task creation form.
Configuring Your New Branch
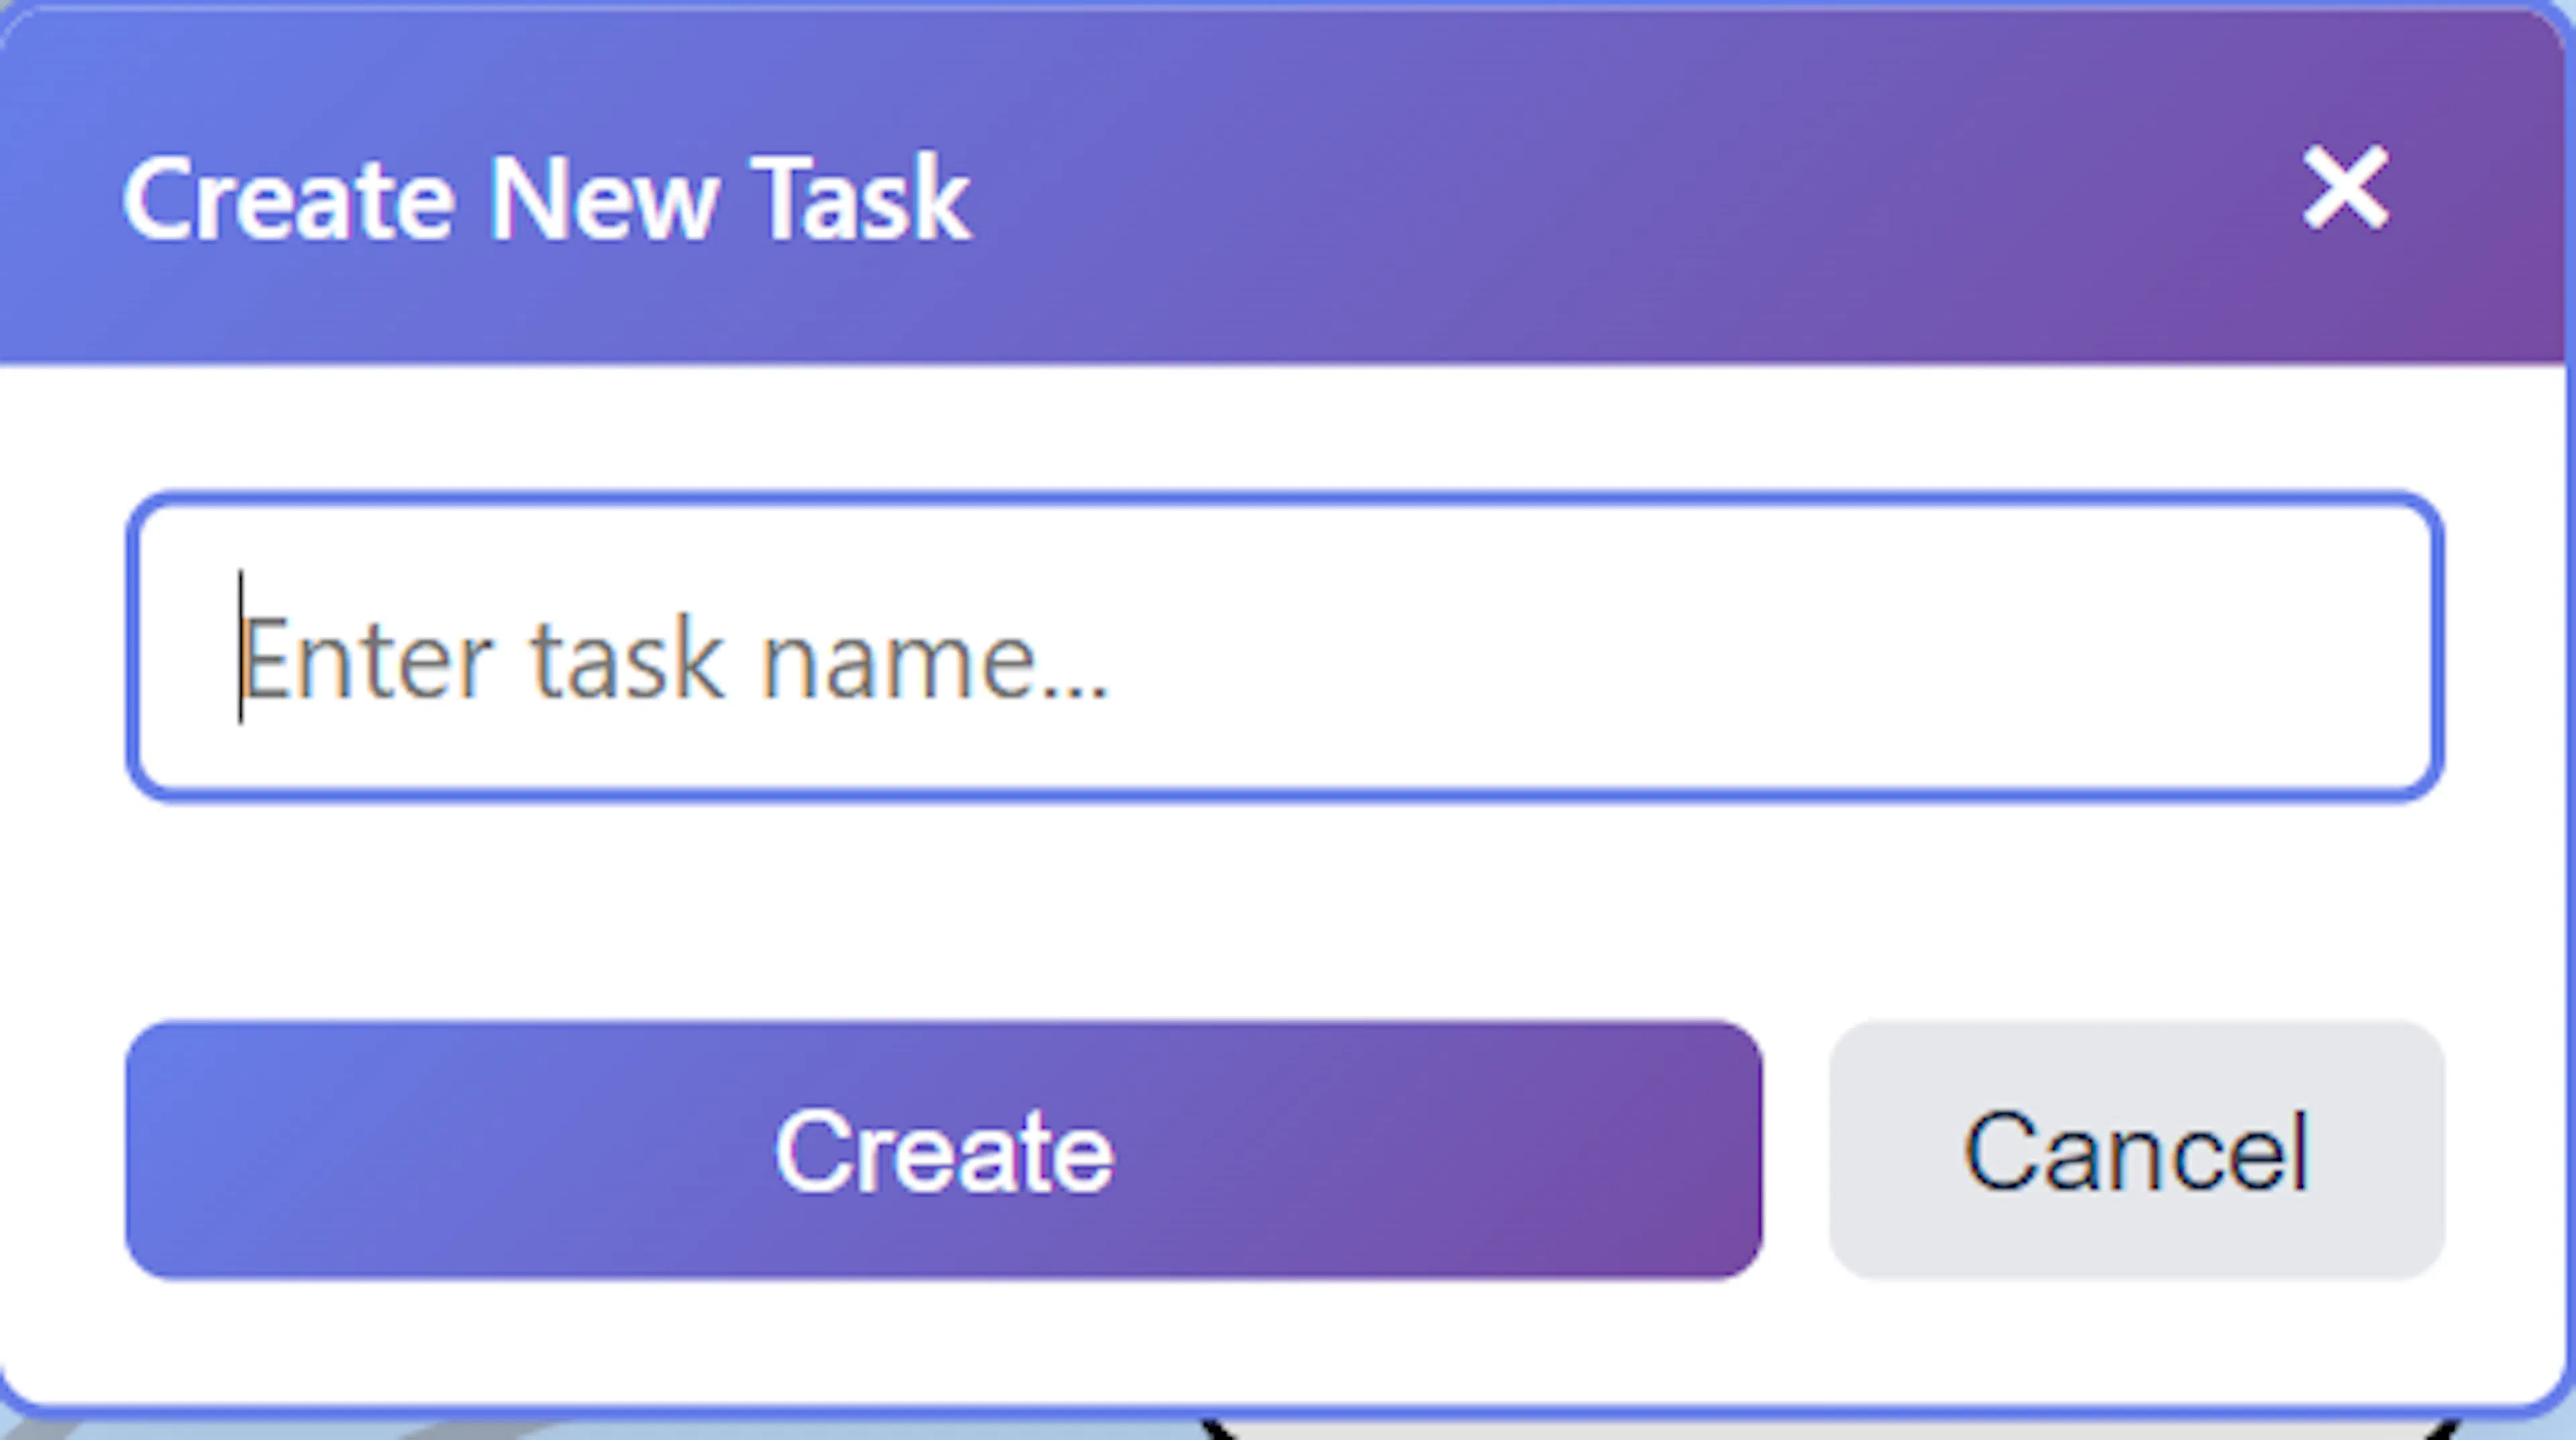
Once you trigger the creation process, an inline form titled "Create New Task" will appear on your canvas. Here is how to configure your first node:
Task Name: Enter the name of your task or category in the provided text input field. Note that the task name cannot be left empty.
- Due Date (if applicable): If you are working in a date-centric session, the form will reveal a date picker. You can use the quick-action buttons to instantly assign the task to Today, Tomorrow, Next Week, or designate it as having No Date. Alternatively, use the calendar input to pick a custom date.
Priority: You can assign an immediate priority level to your new branch, selecting between Urgent, Normal, or Low (Not Urgent).
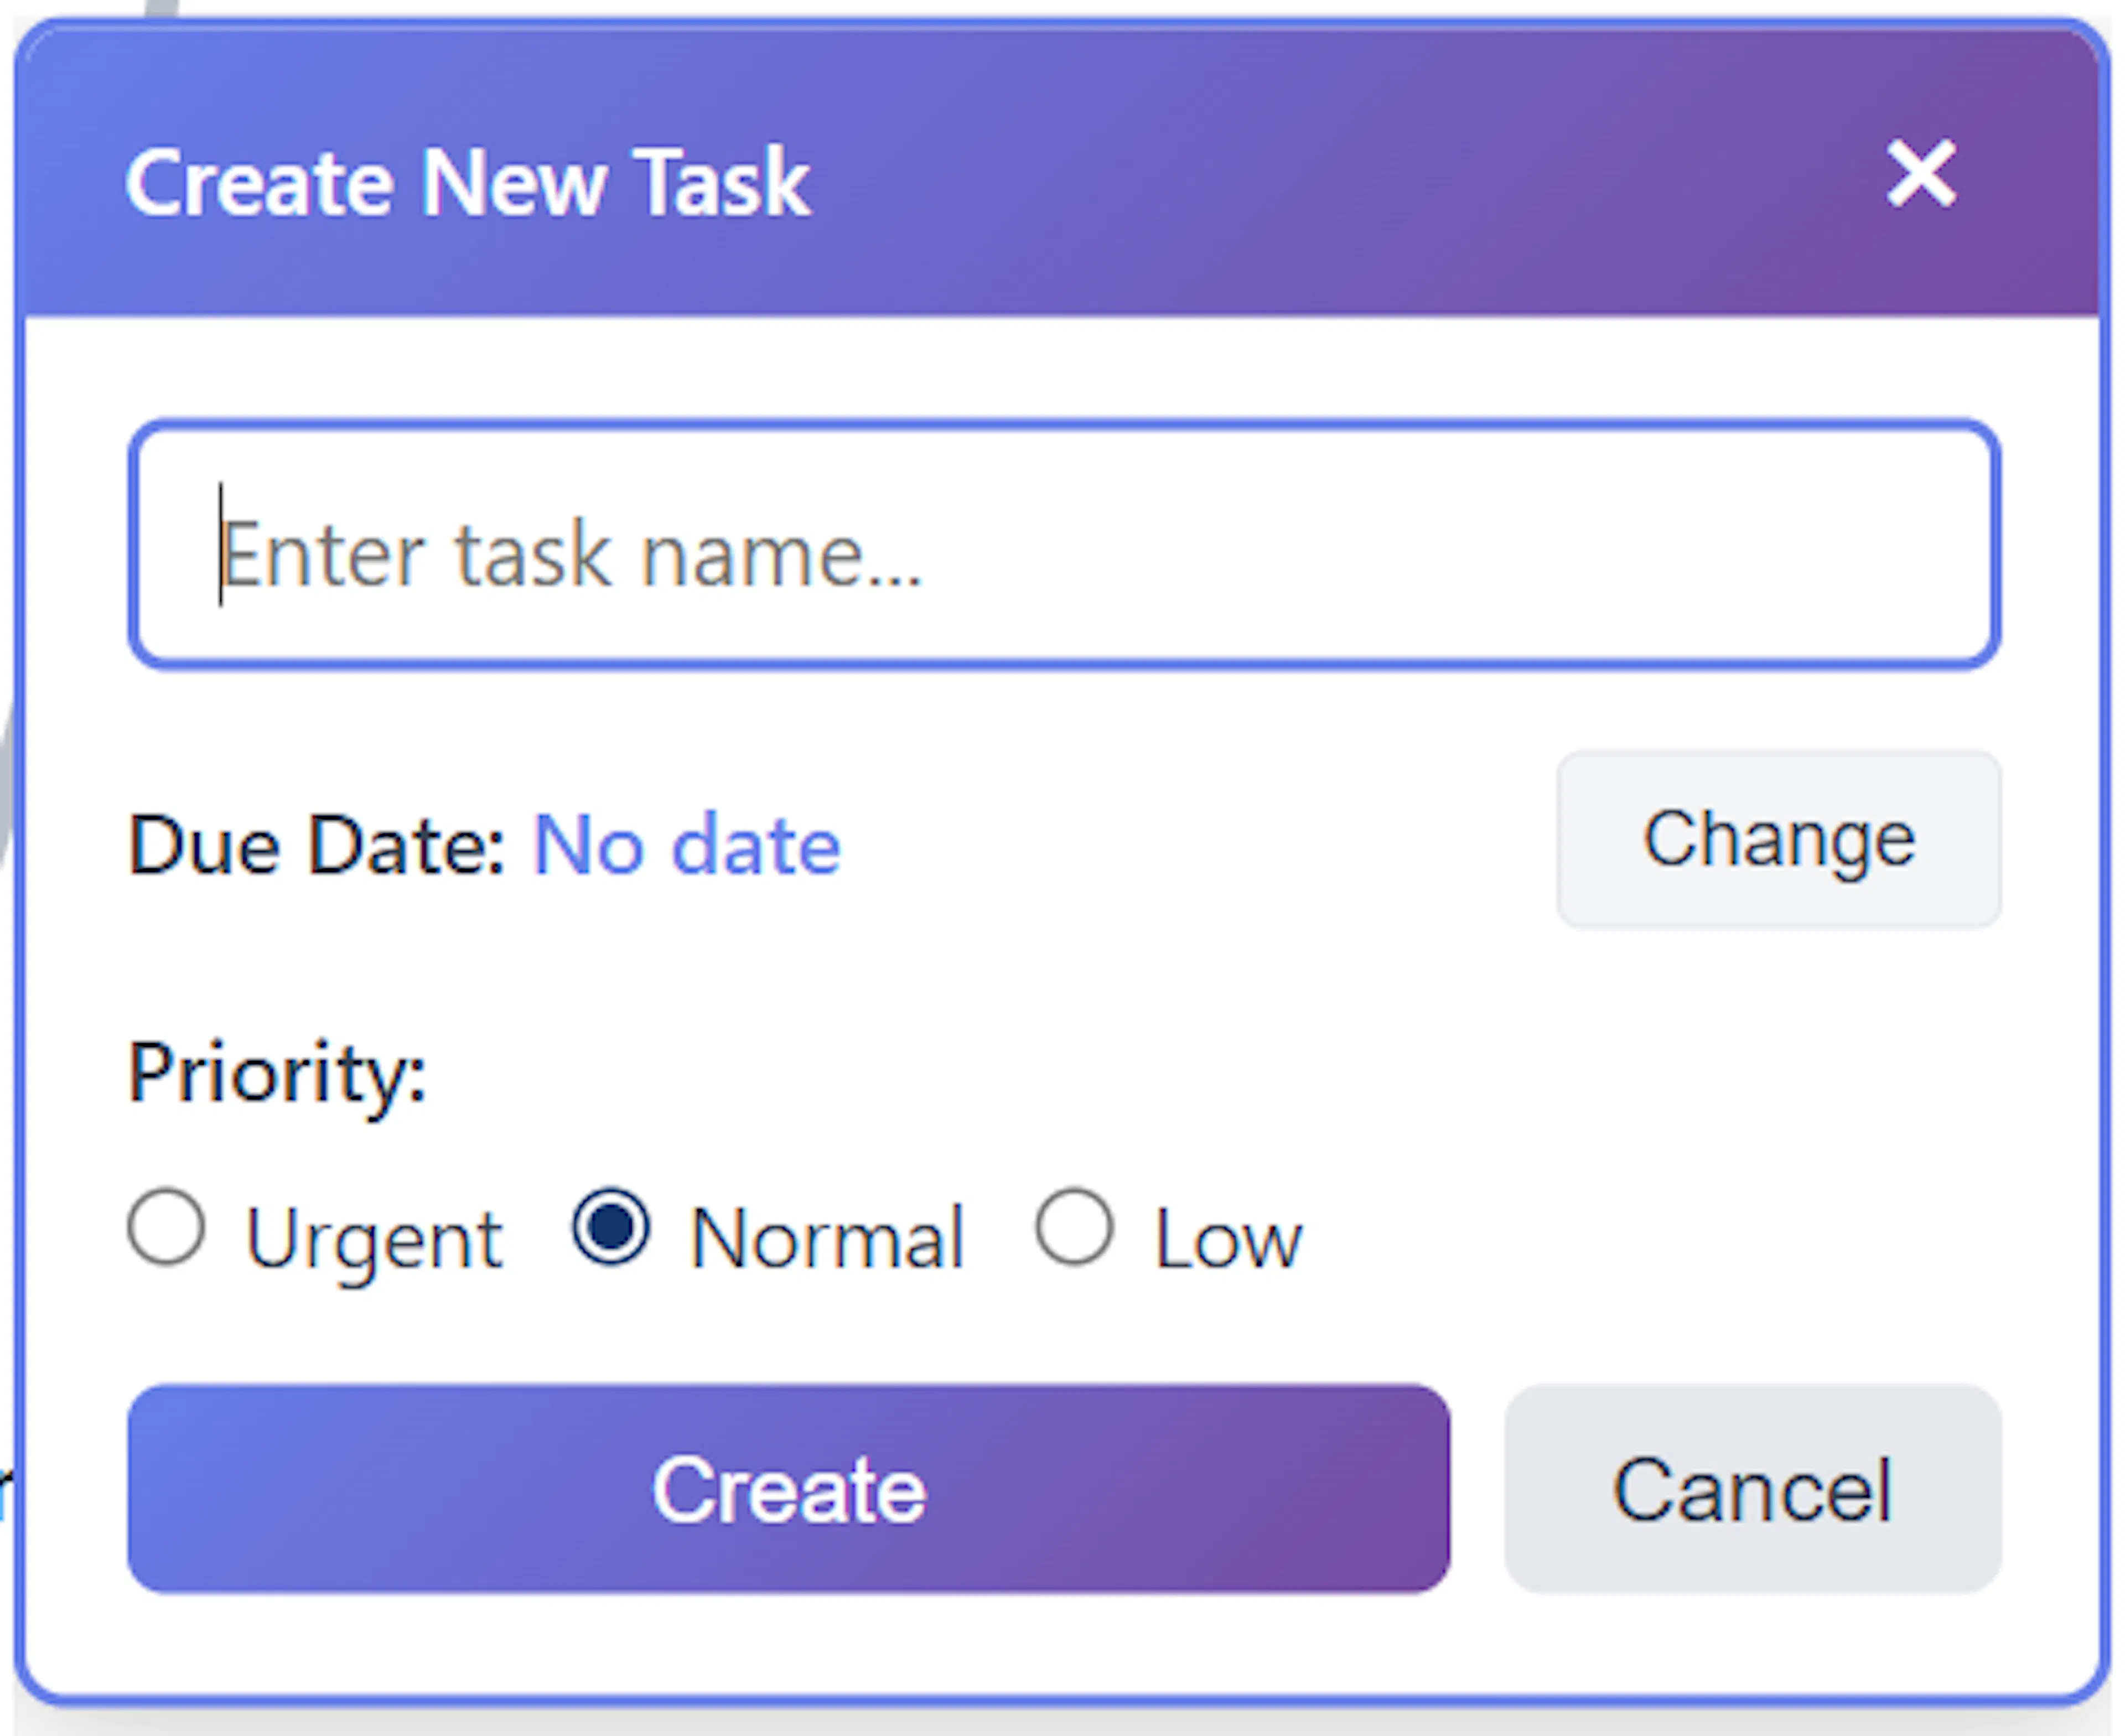
Completing the Creation
To finalise your new branch, simply hit the Enter key on your keyboard or click the Create button at the bottom of the form.
Your new task will be instantly rendered on the canvas, connected directly to the central node. To build out the rest of your primary structure, simply return to the central node and repeat this process.
Expanding Your Mind Map: Creating Child and Sibling Tasks
Once you have established your primary branches from the central node, you can continuously expand your mind map by adding new tasks directly to existing ones. Mind Dump categorises these additions into two types: Child tasks (subtasks nested under the current task) and Sibling tasks (parallel tasks at the same hierarchical level).
You can rapidly build out your tree using either keyboard shortcuts or mouse interactions.
Using Keyboard Shortcuts (Recommended for Speed) For the fastest data entry, you can use keyboard shortcuts to build your map without lifting your hands from the keys. First, select an existing task by clicking on it. Once the node is selected, use the following keys:
-
Create a Child Task (
Tab): Pressing the Tab key will instantly open the inline task creation form, automatically configuring the new task as a subtask of the currently selected node. -
Create a Sibling Task (
Enter): Pressing the Enter key will open the inline form to create a new task at the exact same hierarchical level as your currently selected task.
Using Mouse Actions and Quick Action Buttons If you prefer navigating with your mouse, you can use the built-in Quick Action buttons.
Revealing the Buttons: To access these controls, simply click on any existing task node.
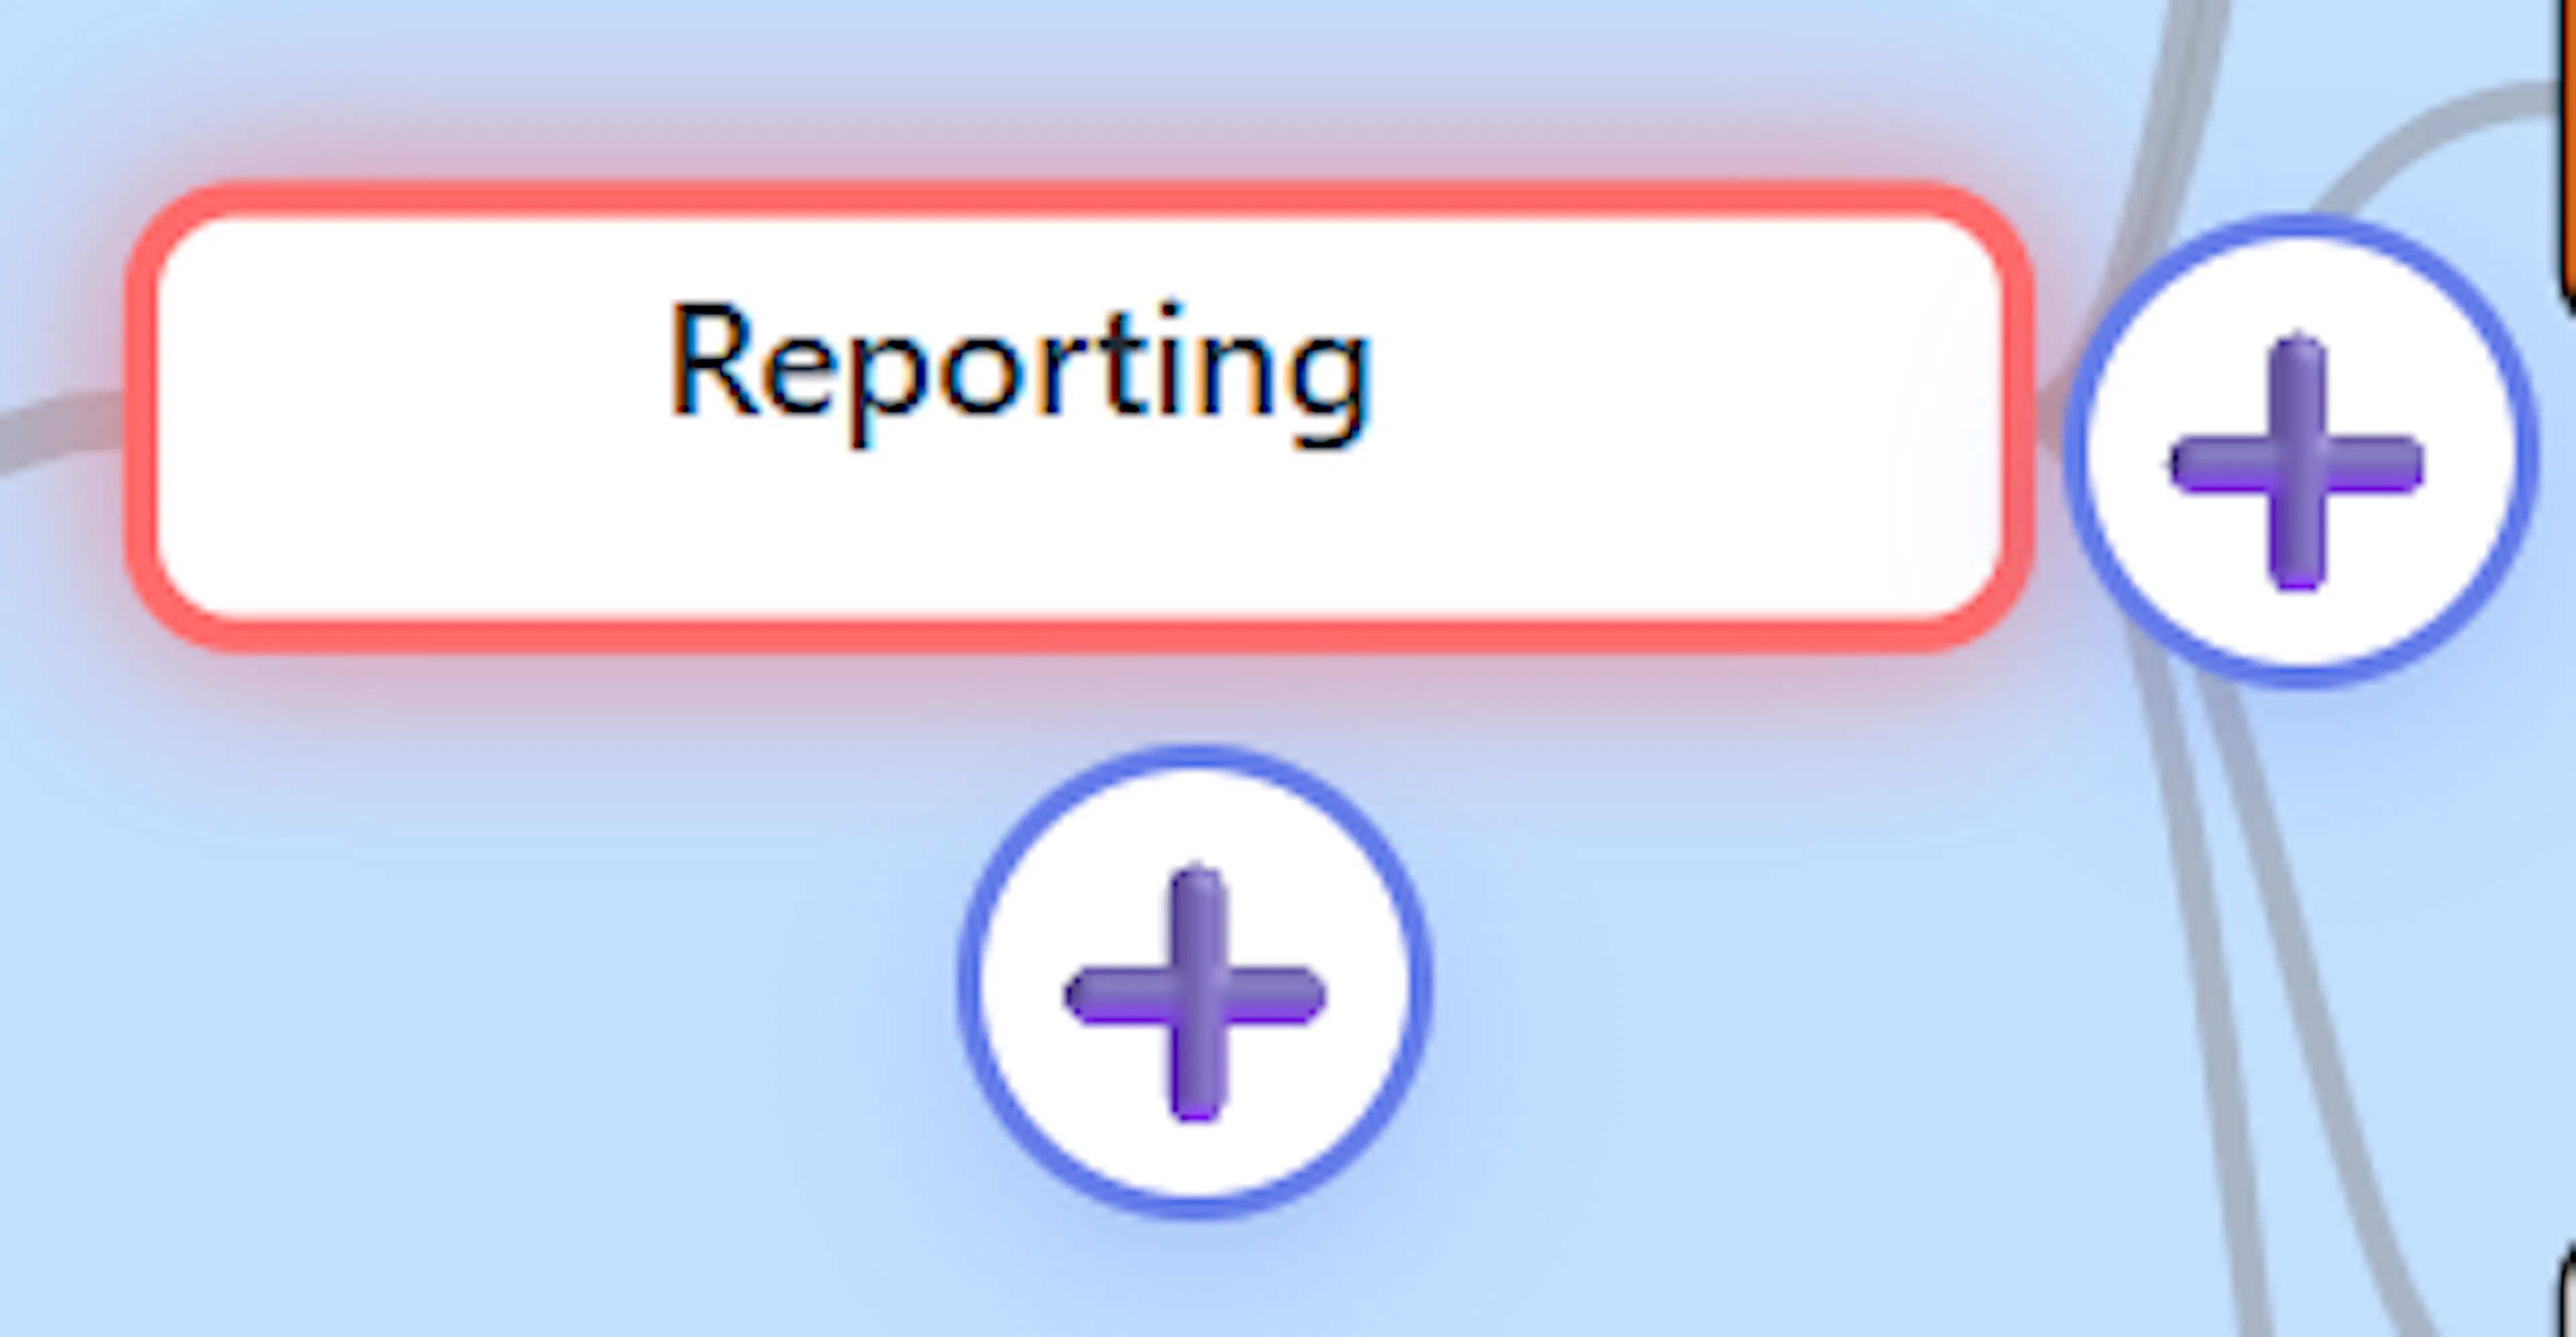
-
Adding the Tasks: Clicking will reveal interactive "+" (plus) marks directly around the node.
-
Click the "+" mark positioned at the end of the node (to the left or right, depending on the branch's direction) to add a Child task.
-
Click the "+" mark positioned directly below the node to add a Sibling task.
-
Whether you use the keyboard or the mouse, triggering these actions will bring up the standard "Create New Task" form, allowing you to instantly type the task name, adjust its due date, and set its priority before it renders on the canvas.
Navigating the Mind Map via Keyboard
While Mind Dump offers intuitive mouse controls, power users can navigate and build their mind maps entirely using the keyboard. This allows for rapid traversal and data entry without ever reaching for the mouse.
Initialising Keyboard Navigation To begin navigating with your keyboard, you must first set a starting point. Simply single-click on any node (a task, category, or the central node) on the canvas. A highlight outline will appear around the node to indicate it is currently selected and active for keyboard navigation.
Horizontal Movement (Left and Right Arrows) The Left Arrow and Right Arrow keys allow you to traverse inward toward the central node or outward deeper into your branches:
-
Moving Outward: If you are on the right side of the mind map, pressing the Right arrow moves you deeper into the child nodes of that branch until there are no further nodes. If you are on the left side, the Left arrow accomplishes this same outward movement.
-
Moving Inward: Conversely, pressing the Left arrow while on the right side of the map will move you backward to the parent node. Continuing to press it will eventually land you on the Central Node.
Vertical Movement (Up and Down Arrows) The Up Arrow and Down Arrow keys allow you to navigate vertically between sibling nodes that share the same parent and exist on the exact same hierarchical level. You can cycle up and down through these parallel lists of tasks or categories seamlessly.
Crossing the Central Node When your inward navigation brings you back to the Central Node, you can easily cross over to the opposite side of your mind map. If the Central Node is selected and you press the Left or Right arrow key, Mind Dump will automatically navigate to the uppermost root task or category on that respective side. This intentionally places your selection at the very top of that side's list, ready for you to navigate downward through the branches.
Rapidly Creating New Nodes Keyboard navigation pairs perfectly with Mind Dump's rapid task creation shortcuts. Once you have navigated to your desired node using the arrow keys, you can instantly expand the map:
-
Press Enter to create a Sibling task directly below your currently selected node.
-
Press Tab to create a Child task branching outward from your currently selected node.
Renaming a Node
To change the name of an existing task directly on your mind map, you can use the inline editing feature.
Step-by-Step Instructions:
-
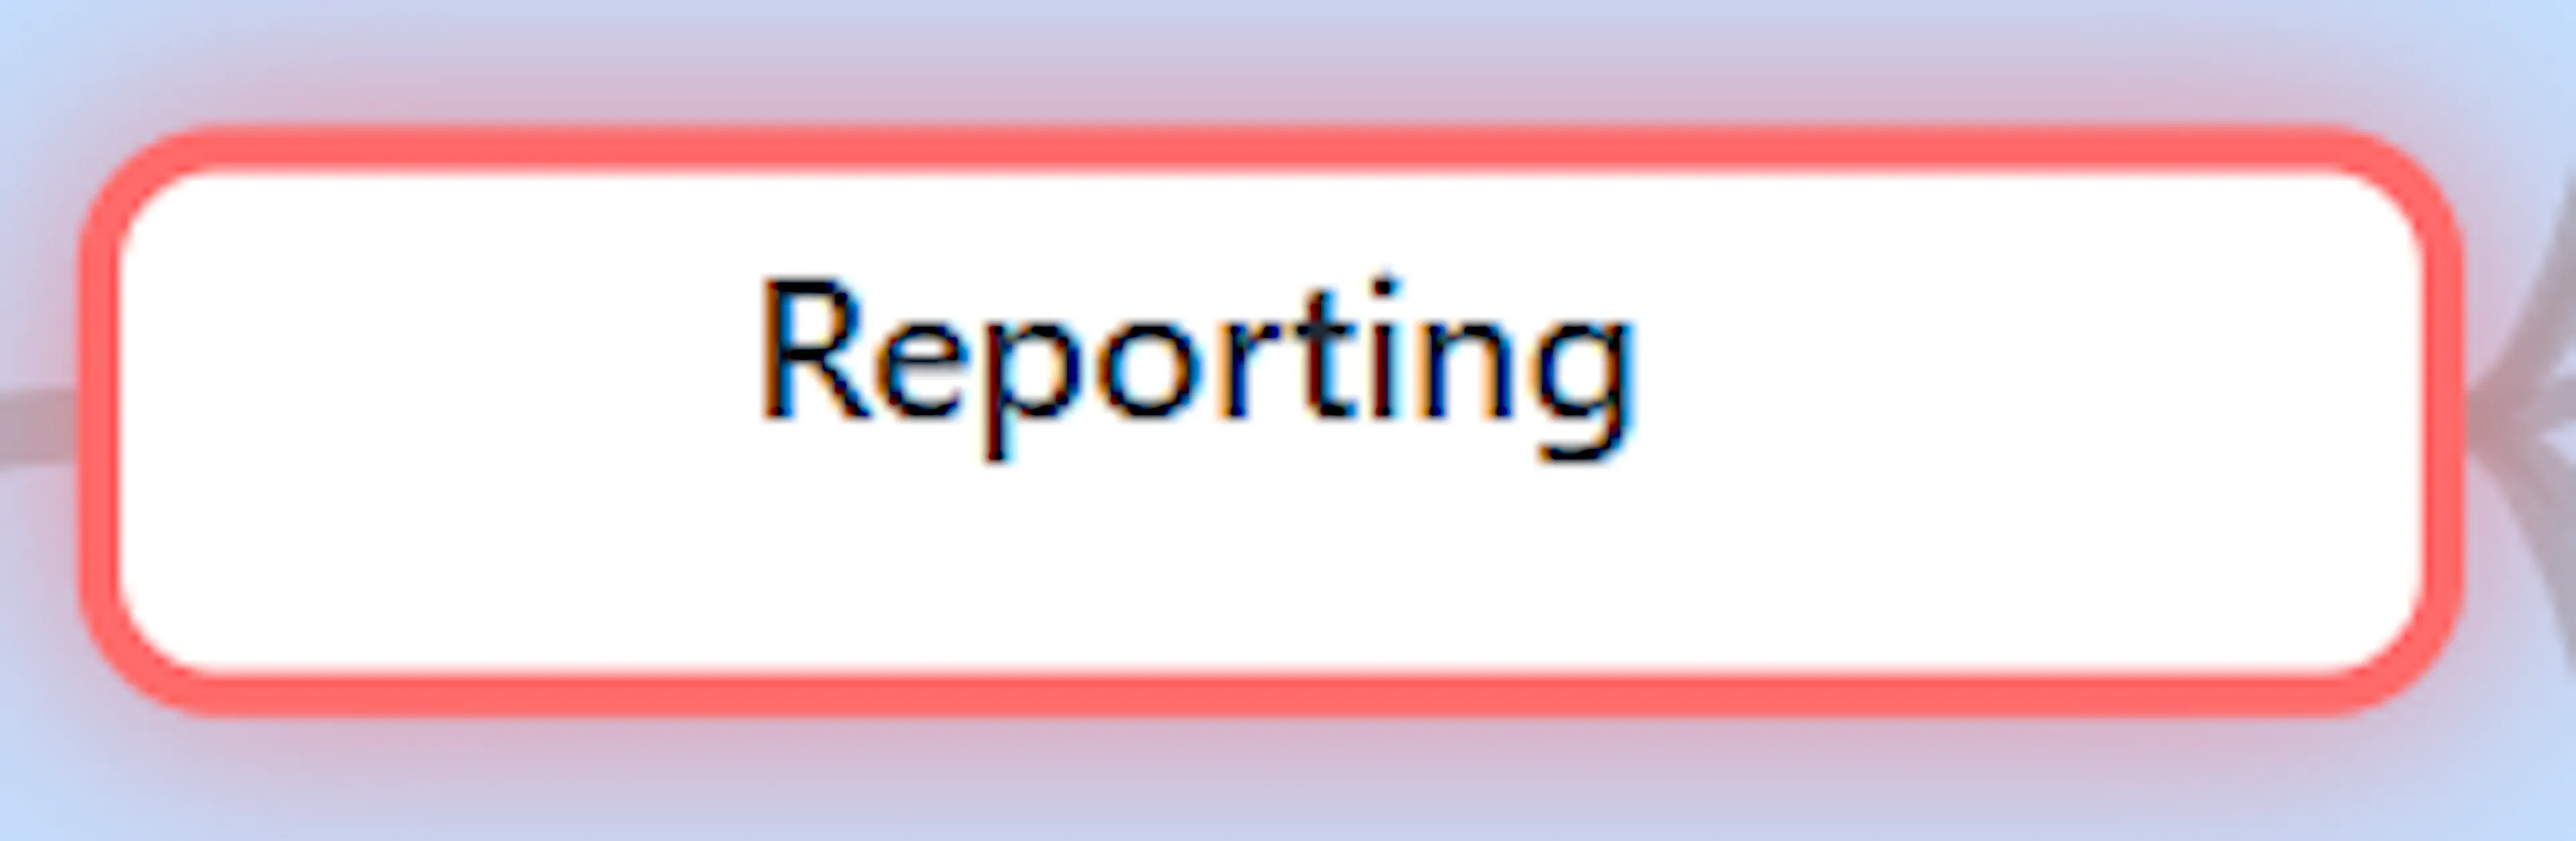
Select the Node: Start by clicking once on the node you want to rename, which will highlight it as your active selection.
-
Click Again: After a brief pause, single-click the same node a second time. Note: The brief pause is important. If you perform a rapid double-click, the app will interpret that as a command to expand or collapse the node's branches rather than an instruction to edit the text.
-
Make Your Edit: The node will instantly transform into an editable text field, allowing you to type out the new name
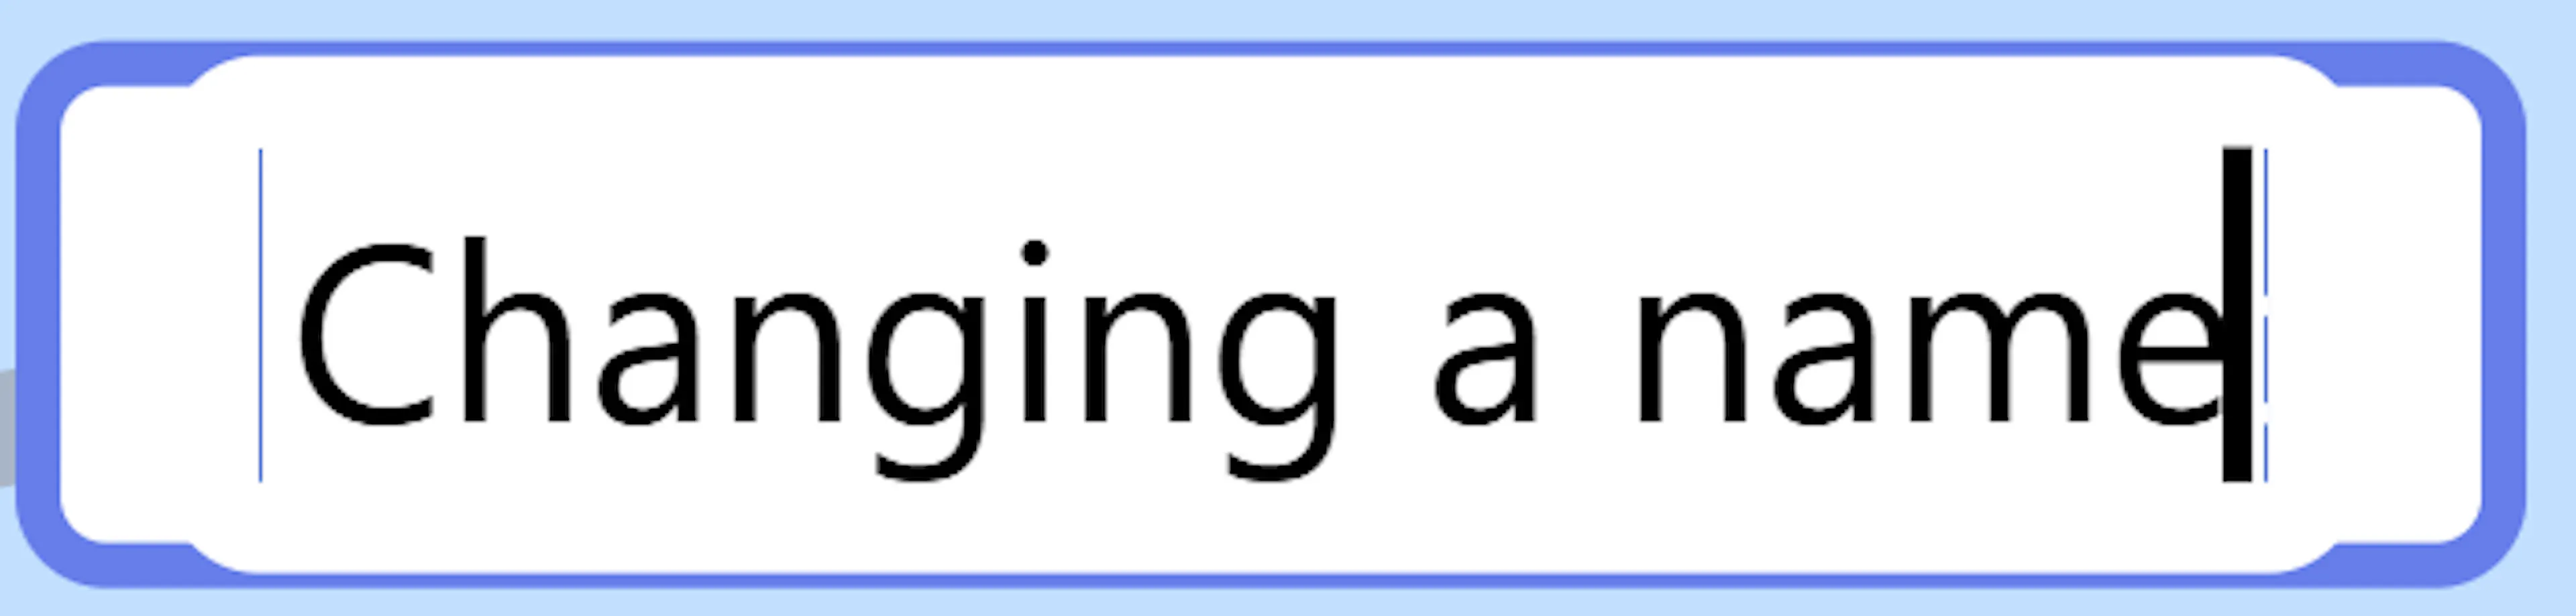
Changing a name inline in a node -
Commit the Change: Once you are satisfied with your edits, simply press the Enter key on your keyboard to save the changes. Alternatively, clicking anywhere else on the mind map canvas will also commit the save. If you change your mind while editing, pressing the Escape key will cancel the process and revert the node to its original name.
System-Wide Updates Because the Mind Map view is directly integrated with your core data, renaming a node immediately updates the underlying task record in your database. This means that the new task name will instantly be reflected across all other views and features throughout the Mind Dump application.
Accessing the Node Menu
To access the full suite of actions for a specific task, simply right-click on the node. This action will pin the node's menu (or hover card) to the screen, revealing several powerful options to manage your task.
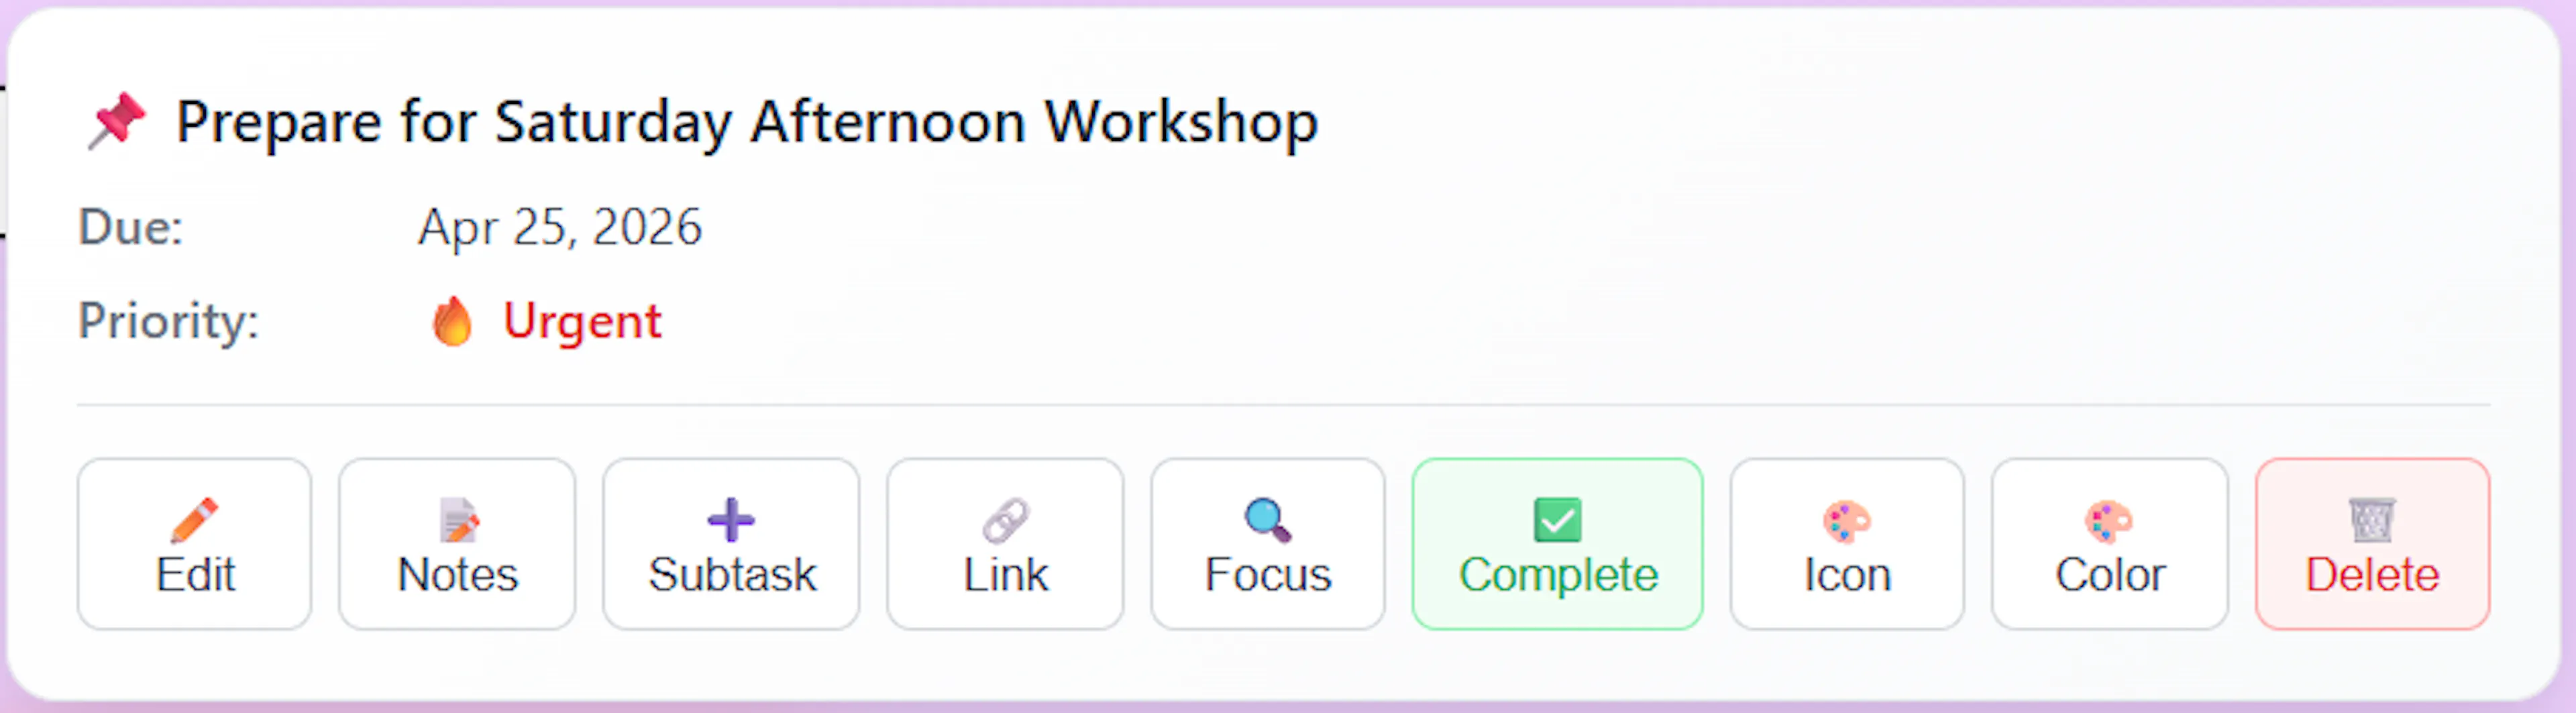
Here is a brief breakdown of the purpose of each menu item:
-
Edit: Opens the Universal Task Edit dialogue, where you can modify any details and properties about the task.
-
Notes: Opens the notes viewer, allowing you to read or edit text notes associated with the task.
-
Sub-task: Instantly adds a new child task, branching off from the selected node. This is the same action as using the Tab key or clicking the child + mark on a node.
-
Link: Initiates the creation of a custom link line to visually connect this node to another node on your canvas.
-
Focus: Changes the view of the mind map to focus exclusively on that single node, displaying only it and its children extending from the central node.
-
Complete: Marks the task as finished. Note: The complete option is only available when viewing a Date-centric mind map.
-
Icon: Opens an icon picker, allowing you to add a single visual icon to the node.
-
Colour: This opens the branch colour picker to apply a custom colour to the selected node, which will automatically cascade down to its children.
-
Delete: Removes the node and its associated task from the database. Note that this option is purposefully disabled and unavailable if the node currently has existing children (sub-tasks).
Once you are finished, you can close the menu by simply clicking anywhere else on the canvas away from the menu.
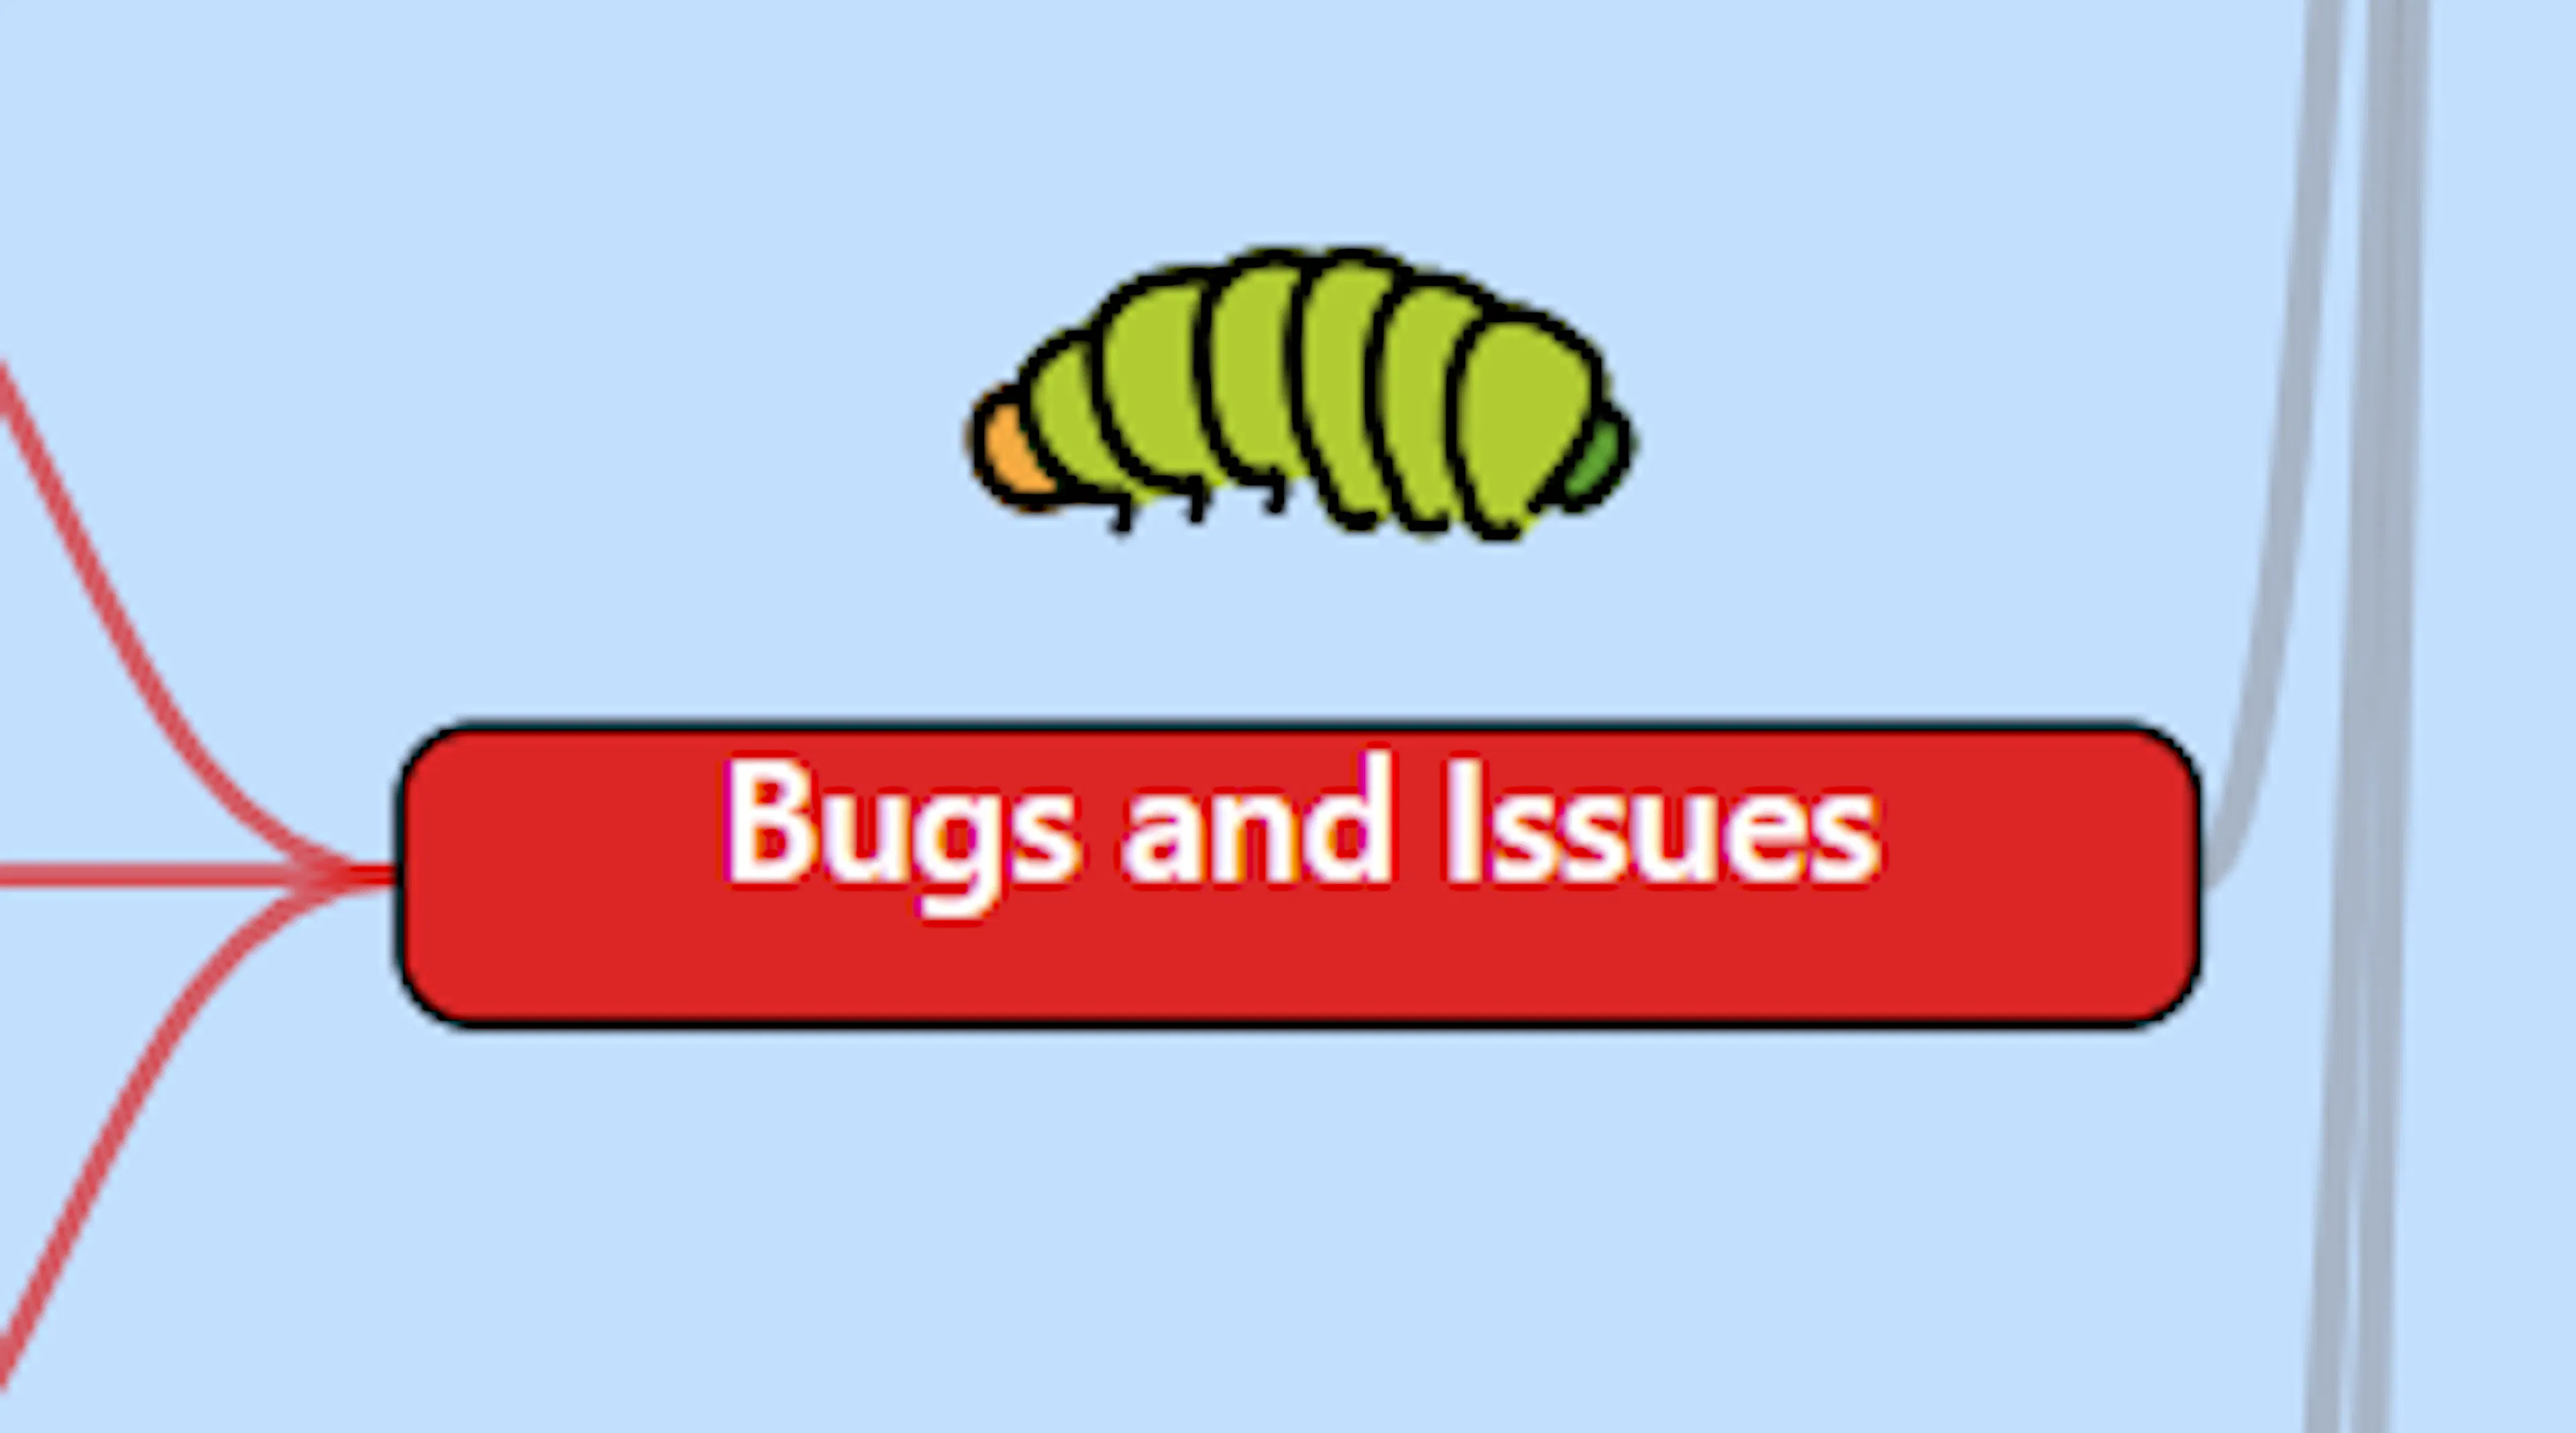
Enhancing Your Mind Map with Icons
Icons serve as powerful visual indicators in your mind map, allowing you to instantly identify task types, priorities, or specific context (such as distinguishing a "meeting" from a "bug" or a "document") without needing to read the task text.
How to Add an Icon to a Node To assign an icon to a specific task node, you can use either the mouse or a keyboard shortcut:
-
Using the Mouse: Right-click the desired node to open its context menu, then select the Icon option.
-
Using the Keyboard: Select the node by clicking it once, then press Cmd+I (Mac) or Alt+I (Windows) to instantly open the Icon Picker.
Icon Attachment and Movement Once you apply an icon to a node, it is rendered directly into the visual structure of that node, positioned just above it. Because the icon is mathematically anchored to the node's central coordinates, it acts as a permanent extension of the node itself. Whether the node is shifted by the automatic layout engine, dragged to a new branch, or moved alongside its parent, the attached icon will perfectly follow the node's movements and scale with it when zooming.
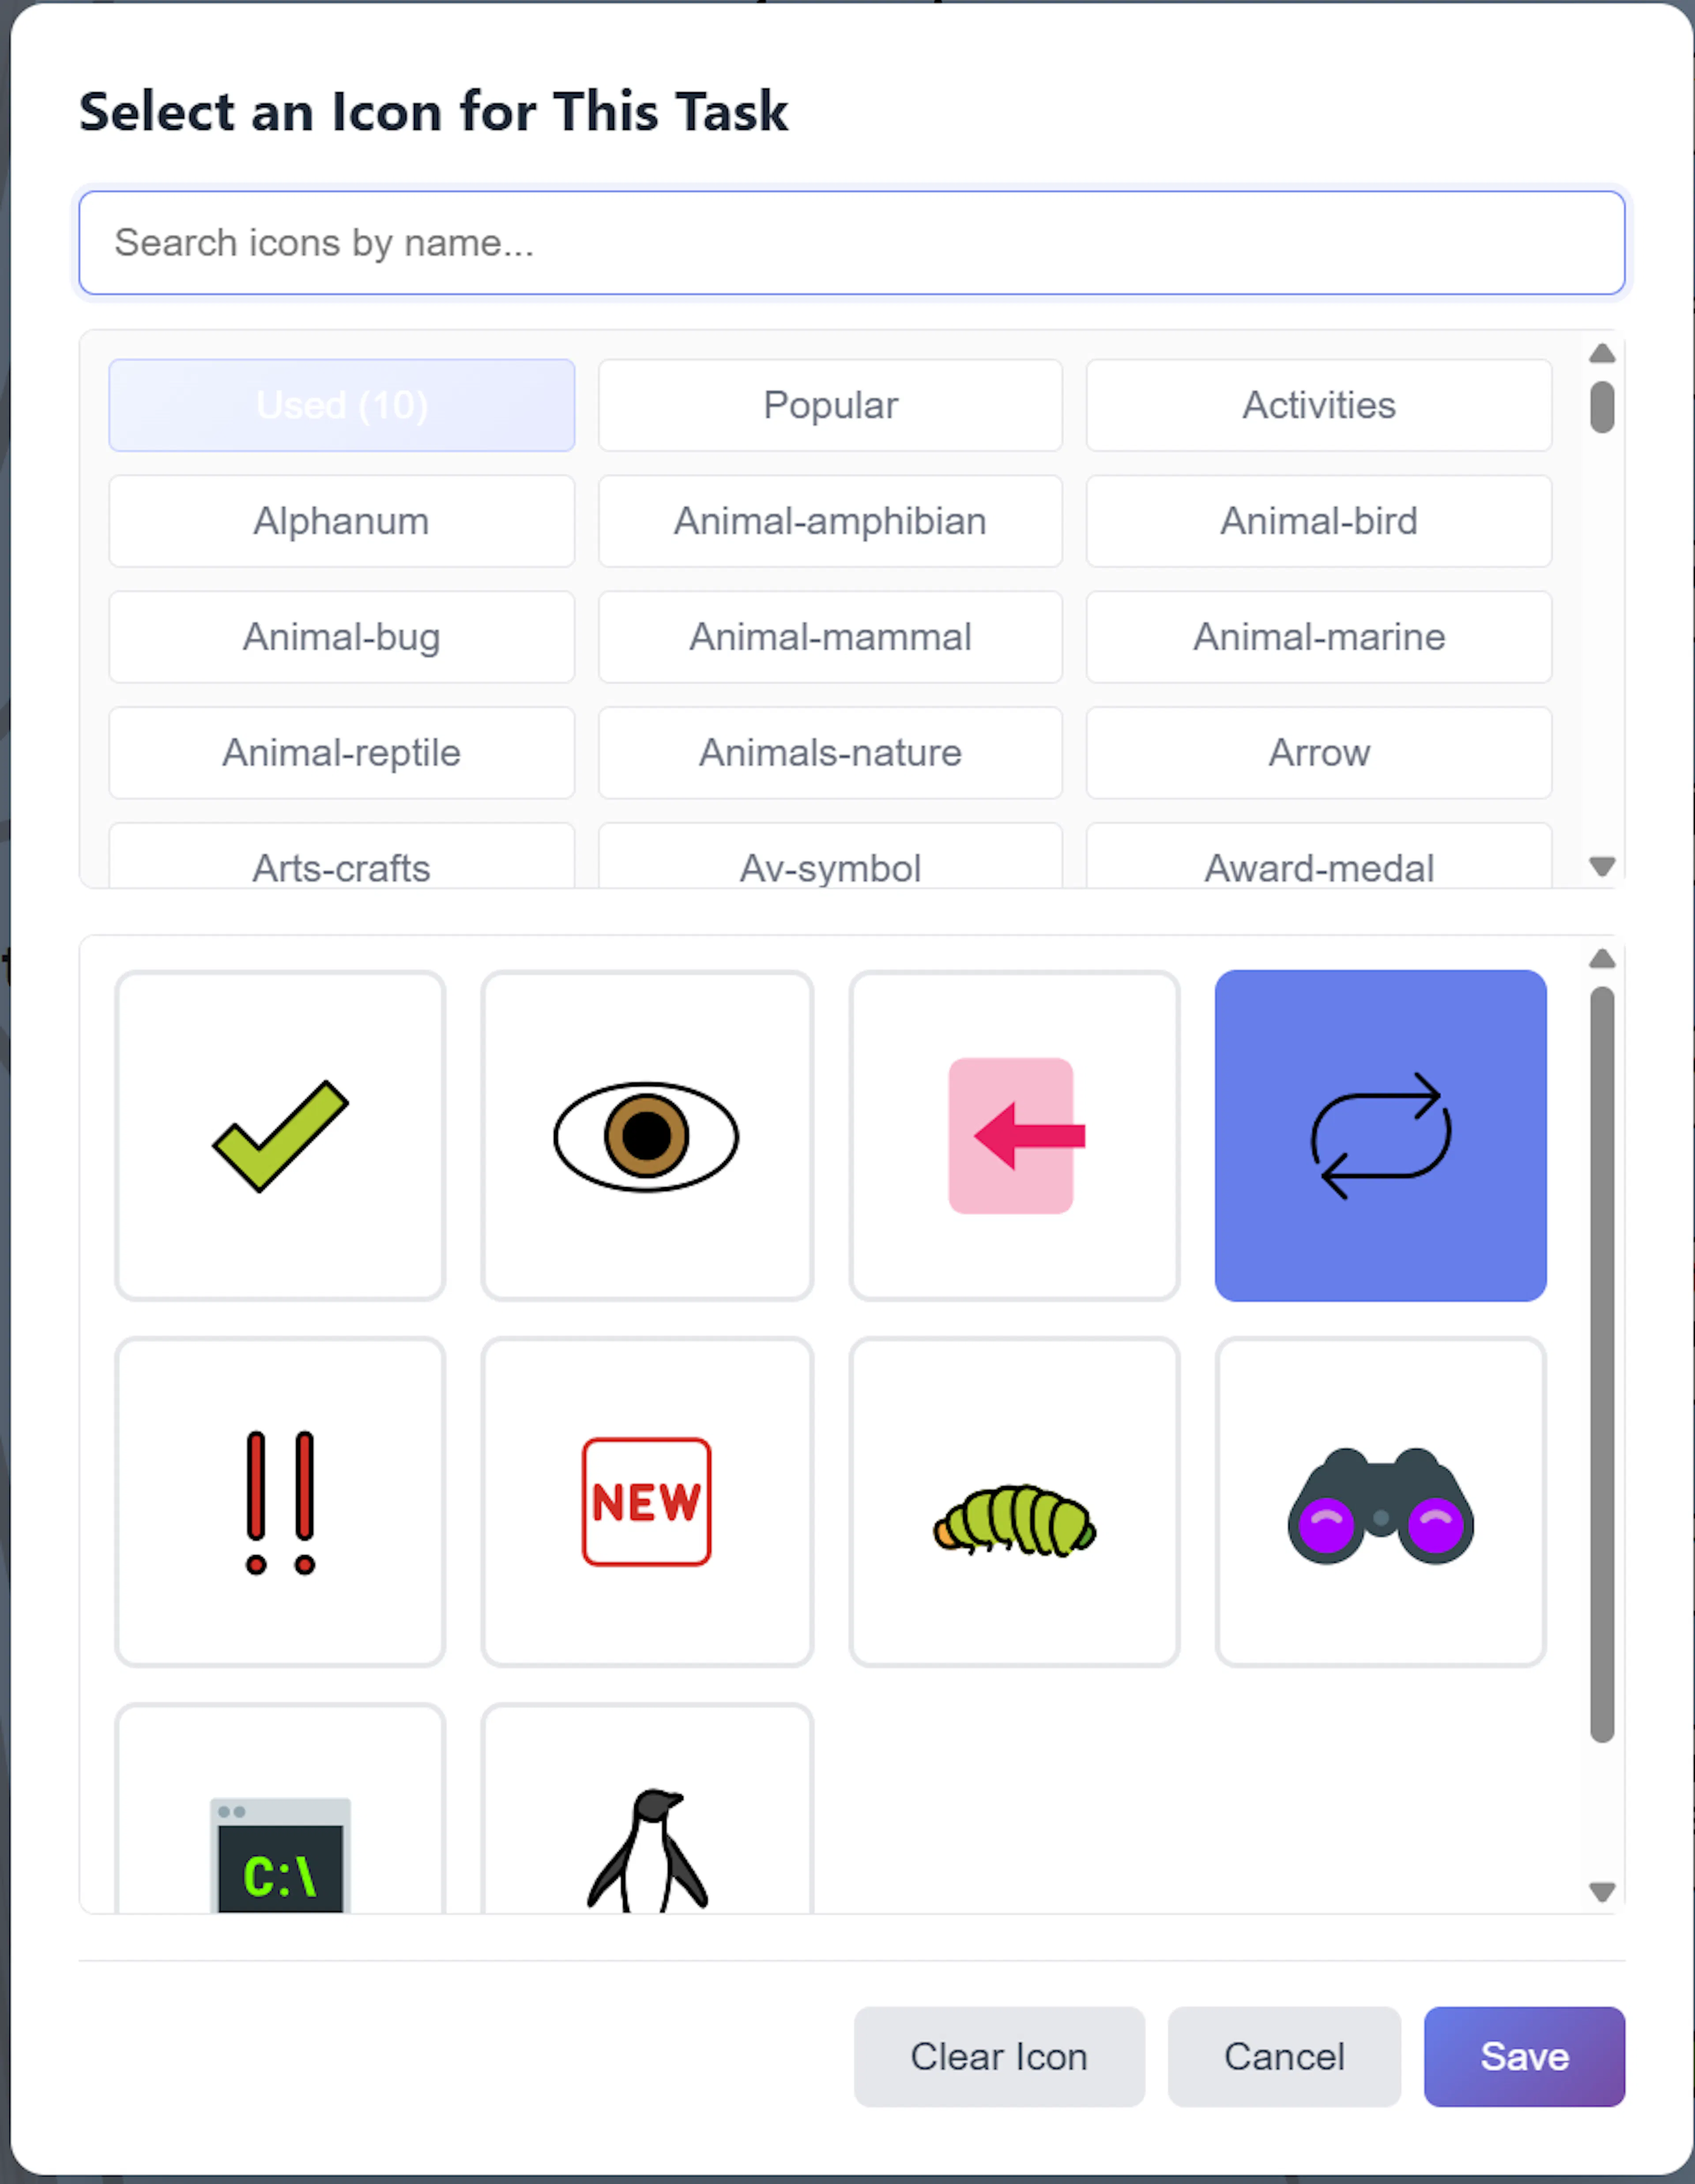
Icon Categories and Searching: Triggering the icon selection opens the Icon Picker Modal, which provides access to an extensive library of Tabler Icons. To help you find the perfect visual representation, the picker is divided into two main navigation methods:
-
Categories: At the top of the modal, you will find a scrollable list of category tabs. It defaults to a "Popular" category, but you can click through various dynamic categories to browse themed grids of icons.
-
Search Box: If you know exactly what you are looking for, you can use the search bar located at the top of the picker. As you type a keyword (e.g., "star" or "alert"), the modal will query the database and generate a dedicated "Search Results" tab displaying all matching icons.
Reusing Icons: The "Already Used" Category
To help you maintain a consistent visual language across your complex projects, the Icon Picker includes a dynamic category dedicated entirely to reuse.
-
Finding Used Icons: When you open the Icon Picker Modal, the very first category tab displayed in the scrollable list is dedicated to the icons already active on your map.
-
How it Works: This tab functions exactly like the standard dynamic categories. Selecting it will generate a grid displaying every unique icon currently attached to a node somewhere in your workspace. This allows you to quickly grab and apply project-specific icons without needing to remember their exact names or search the broader library again.
-
Empty State: Because this category dynamically reads your current canvas, the grid will simply appear empty if you open the Icon Picker on a brand-new mind map or one where no icons have been applied yet.
Selecting and Saving an Icon Once you locate your preferred icon in the grid, simply click on it. The chosen icon will become highlighted to indicate your selection. To finalise the addition and apply the icon to your mind map node, click the Save button located at the bottom of the modal.
Removing an Icon If you decide you no longer want an icon attached to a node, open the Icon Picker Modal for that specific node again. Instead of selecting a new icon, click the Clear Icon button at the bottom of the modal. This will immediately remove the icon from the node and update your database.
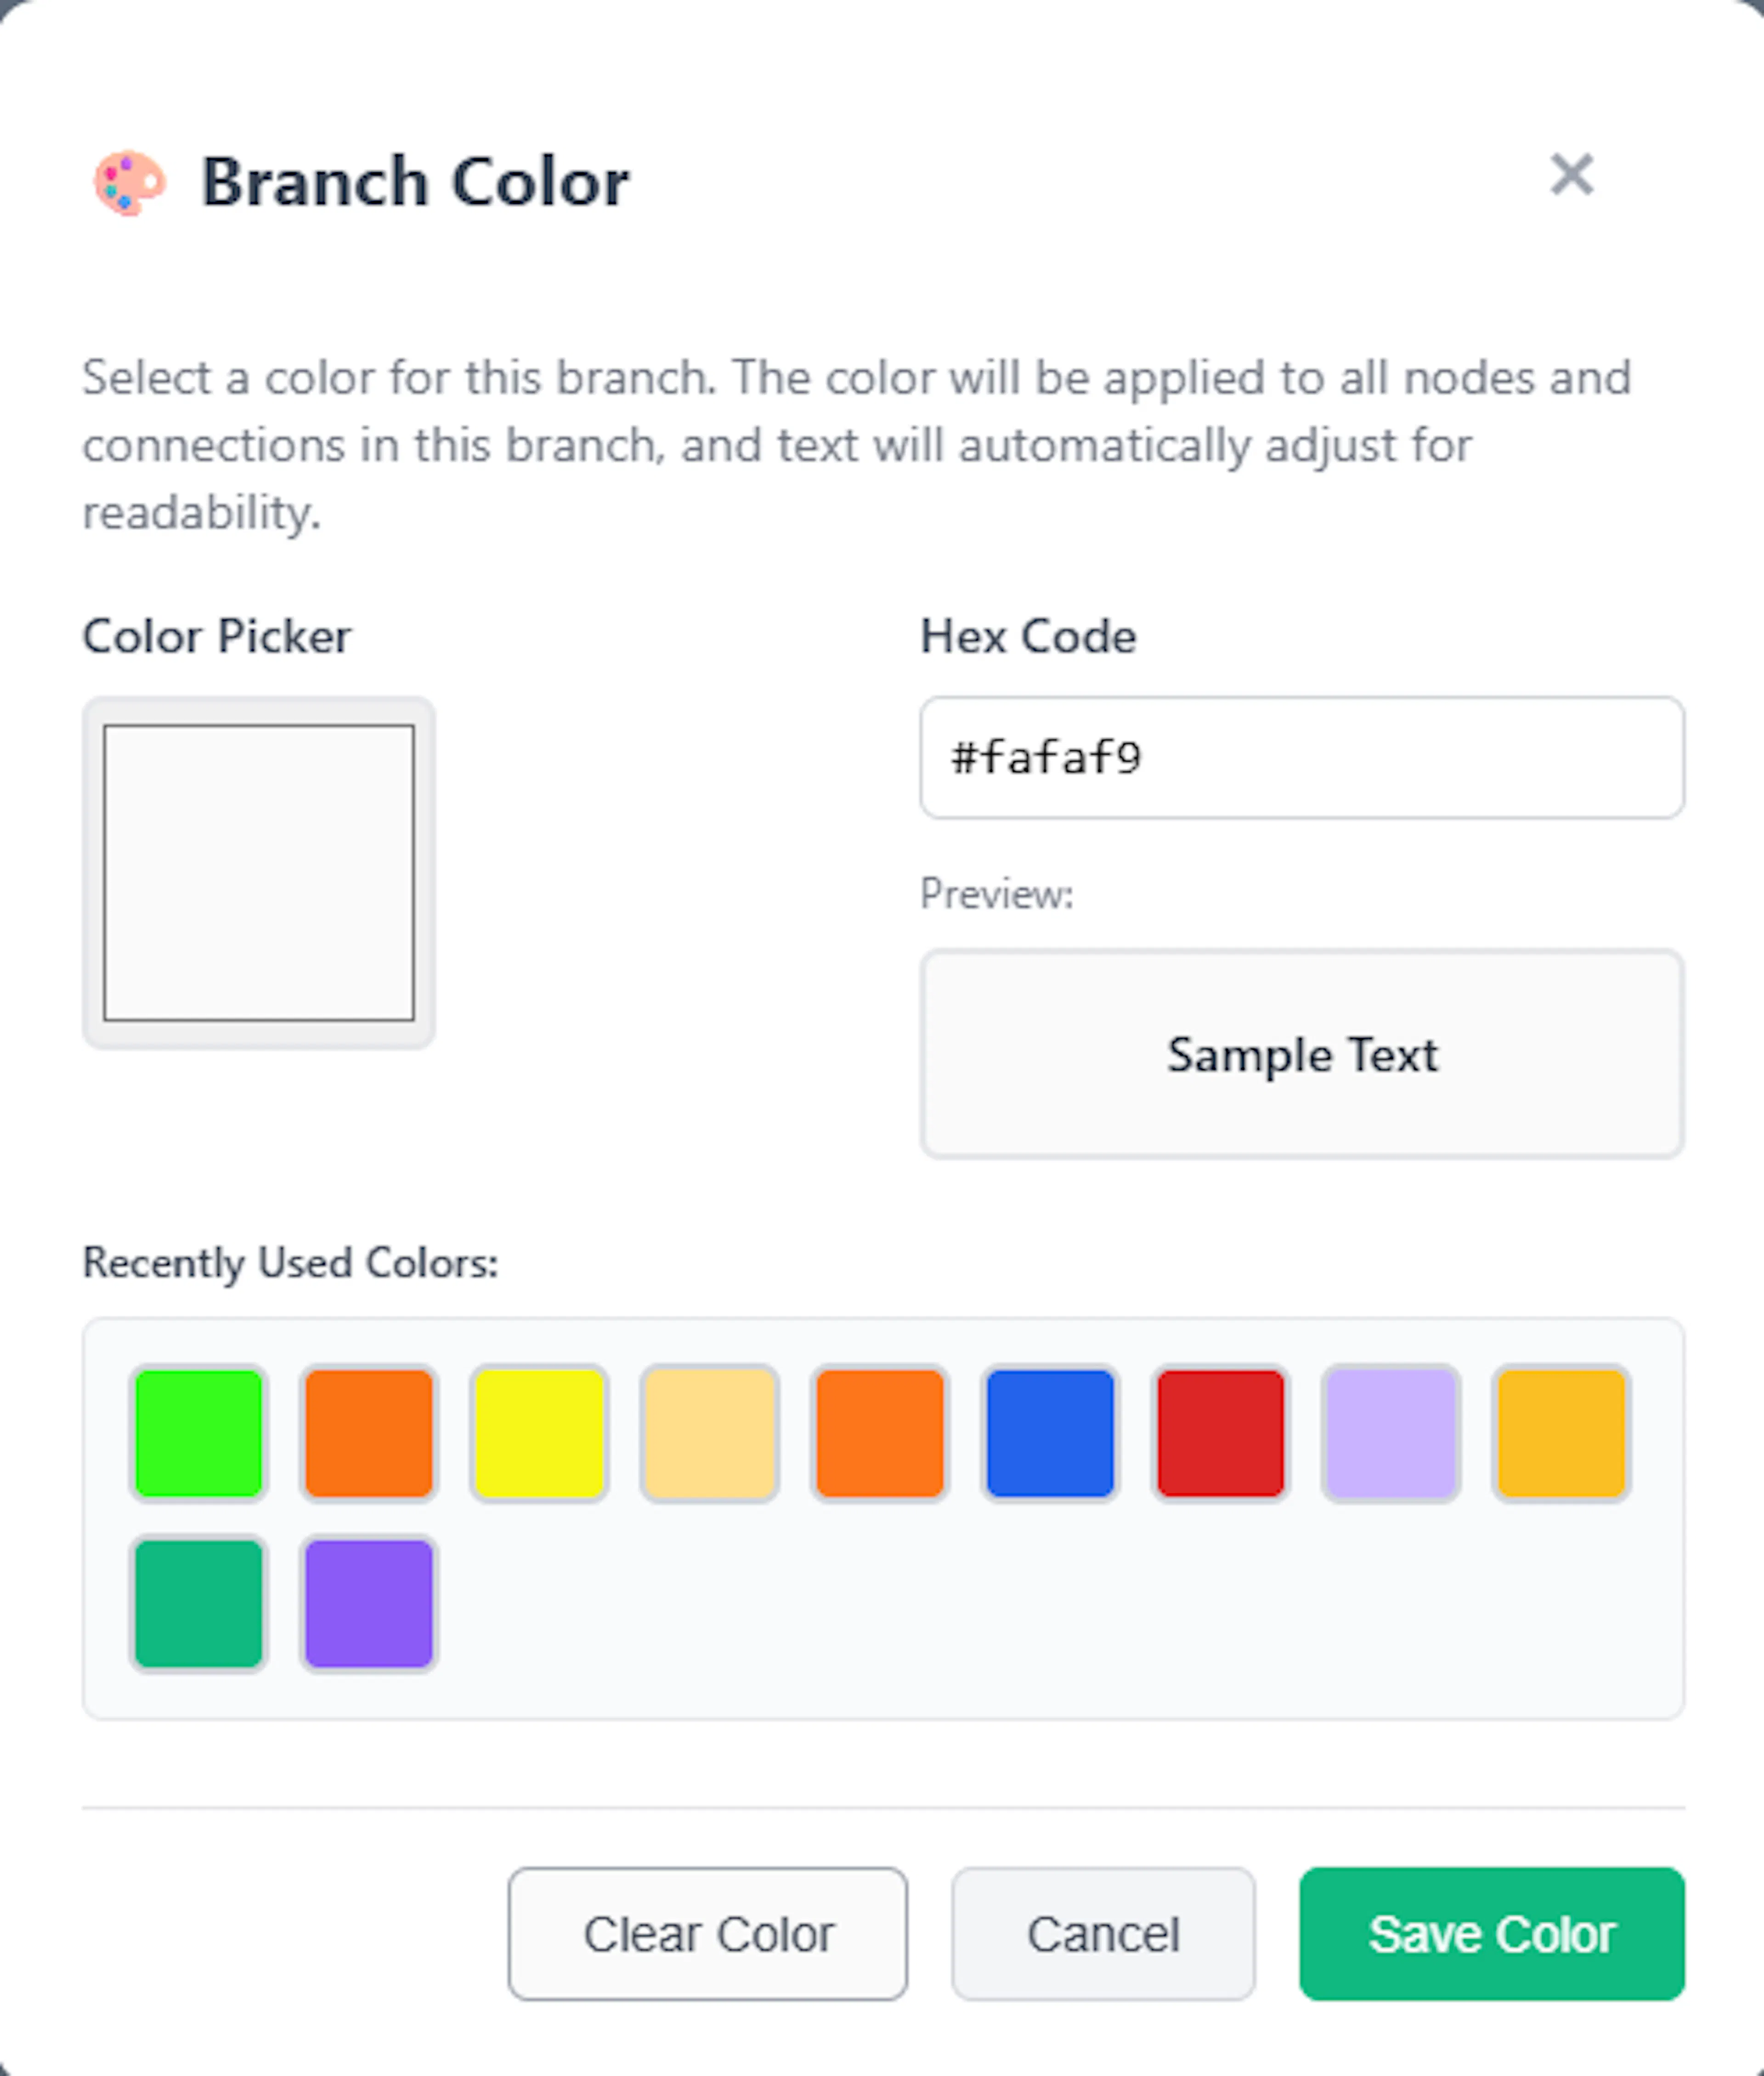
Node Colors: Styling and Organising Your Map
Adding colours to your mind map is an excellent way to visually organise your workspace. Applying specific colours helps you instantly differentiate between different project streams, categories, or branches. Mind Dump also automatically adjusts the text colour (to dark or light) based on your chosen background to ensure perfect readability.
Using the colour picker To change a node's colour, right-click the node to open its context menu (or hover card) and click the 'Colour' button. This opens the branch colour picker, which offers a few ways to select your perfect shade:
-
Colour Square / Colour Picker: Click the colour picker input to open your system's visual colour square, allowing you to manually blend and select any custom colour.
-
Hex Code: If you know the exact colour you want, you can type or paste its Hex code directly into the input field.
-
Recently Used Colours: To help you maintain a consistent visual language, the picker displays a grid of your most recently used colours. This makes it incredibly easy to reuse the exact same shades across your map without needing to remember their specific Hex codes.
Colour Hierarchy and Cascading Mind Dump uses a smart hierarchical colour system. When you apply a colour to a node, that colour automatically cascades down the branch, applying to all of its child tasks and the connecting link lines.
However, you retain full control over downstream items. If you select a child task deeper in the branch and assign it a new colour, that task will adopt the new colour. Furthermore, this new colour will now cascade down to its own children, effectively overriding the original parent's colour for that specific sub-branch.
Removing Colours: If you want to revert a node back to its default styling, open the Colour Picker and click 'Clear Colour'. If you are clearing a parent or group node, you can also use the Clear Branch Colours button, which will not only remove the colour from the selected node but will also cascade the colour removal down through all of its descendant nodes and nested groups.
Coloring in Date-Centric Maps While Alphabetical maps allow complete free-form colouring, Date-centric maps handle colours a bit differently at the top level to help you distinguish your schedule.
In Date-centric maps, the static priority (urgency) groups automatically generate their colours based on the parent Date group. Instead of requiring you to manually colour each priority level, the system automatically rotates the colour hue to provide clear visual differentiation. For example, the "Urgent" group shifts the parent date's colour hue by 90 degrees, while the "Not Urgent" group shifts it by 270 degrees.
Despite this automated grouping at the top, you can still manually colour any individual task node within those groups. If you apply a colour directly to a task inside a date or urgency group, that custom colour will take priority and override the automated grouping colours.
Linking Nodes in Your Mind Map
While the primary structure of your mind map is defined by automatic parent-child hierarchies or date-centric groupings, you will often find that tasks across completely different branches are related. Link lines allow you to draw custom, arbitrary connections between any two items on your canvas (including tasks and text boxes) to visually represent these cross-project dependencies.
Creating a Link Line To establish a new connection between two nodes:
-
Right-click on your starting task or text box to open its context menu.
-
Select the Link (or Add Link) option. Your interface will enter link creation mode, and a status indicator will appear in the menu at the top of your screen.
-
Click on your target task or text box.
A dialogue will immediately appear, asking you to specify the Link Type to define the relationship between the two items.
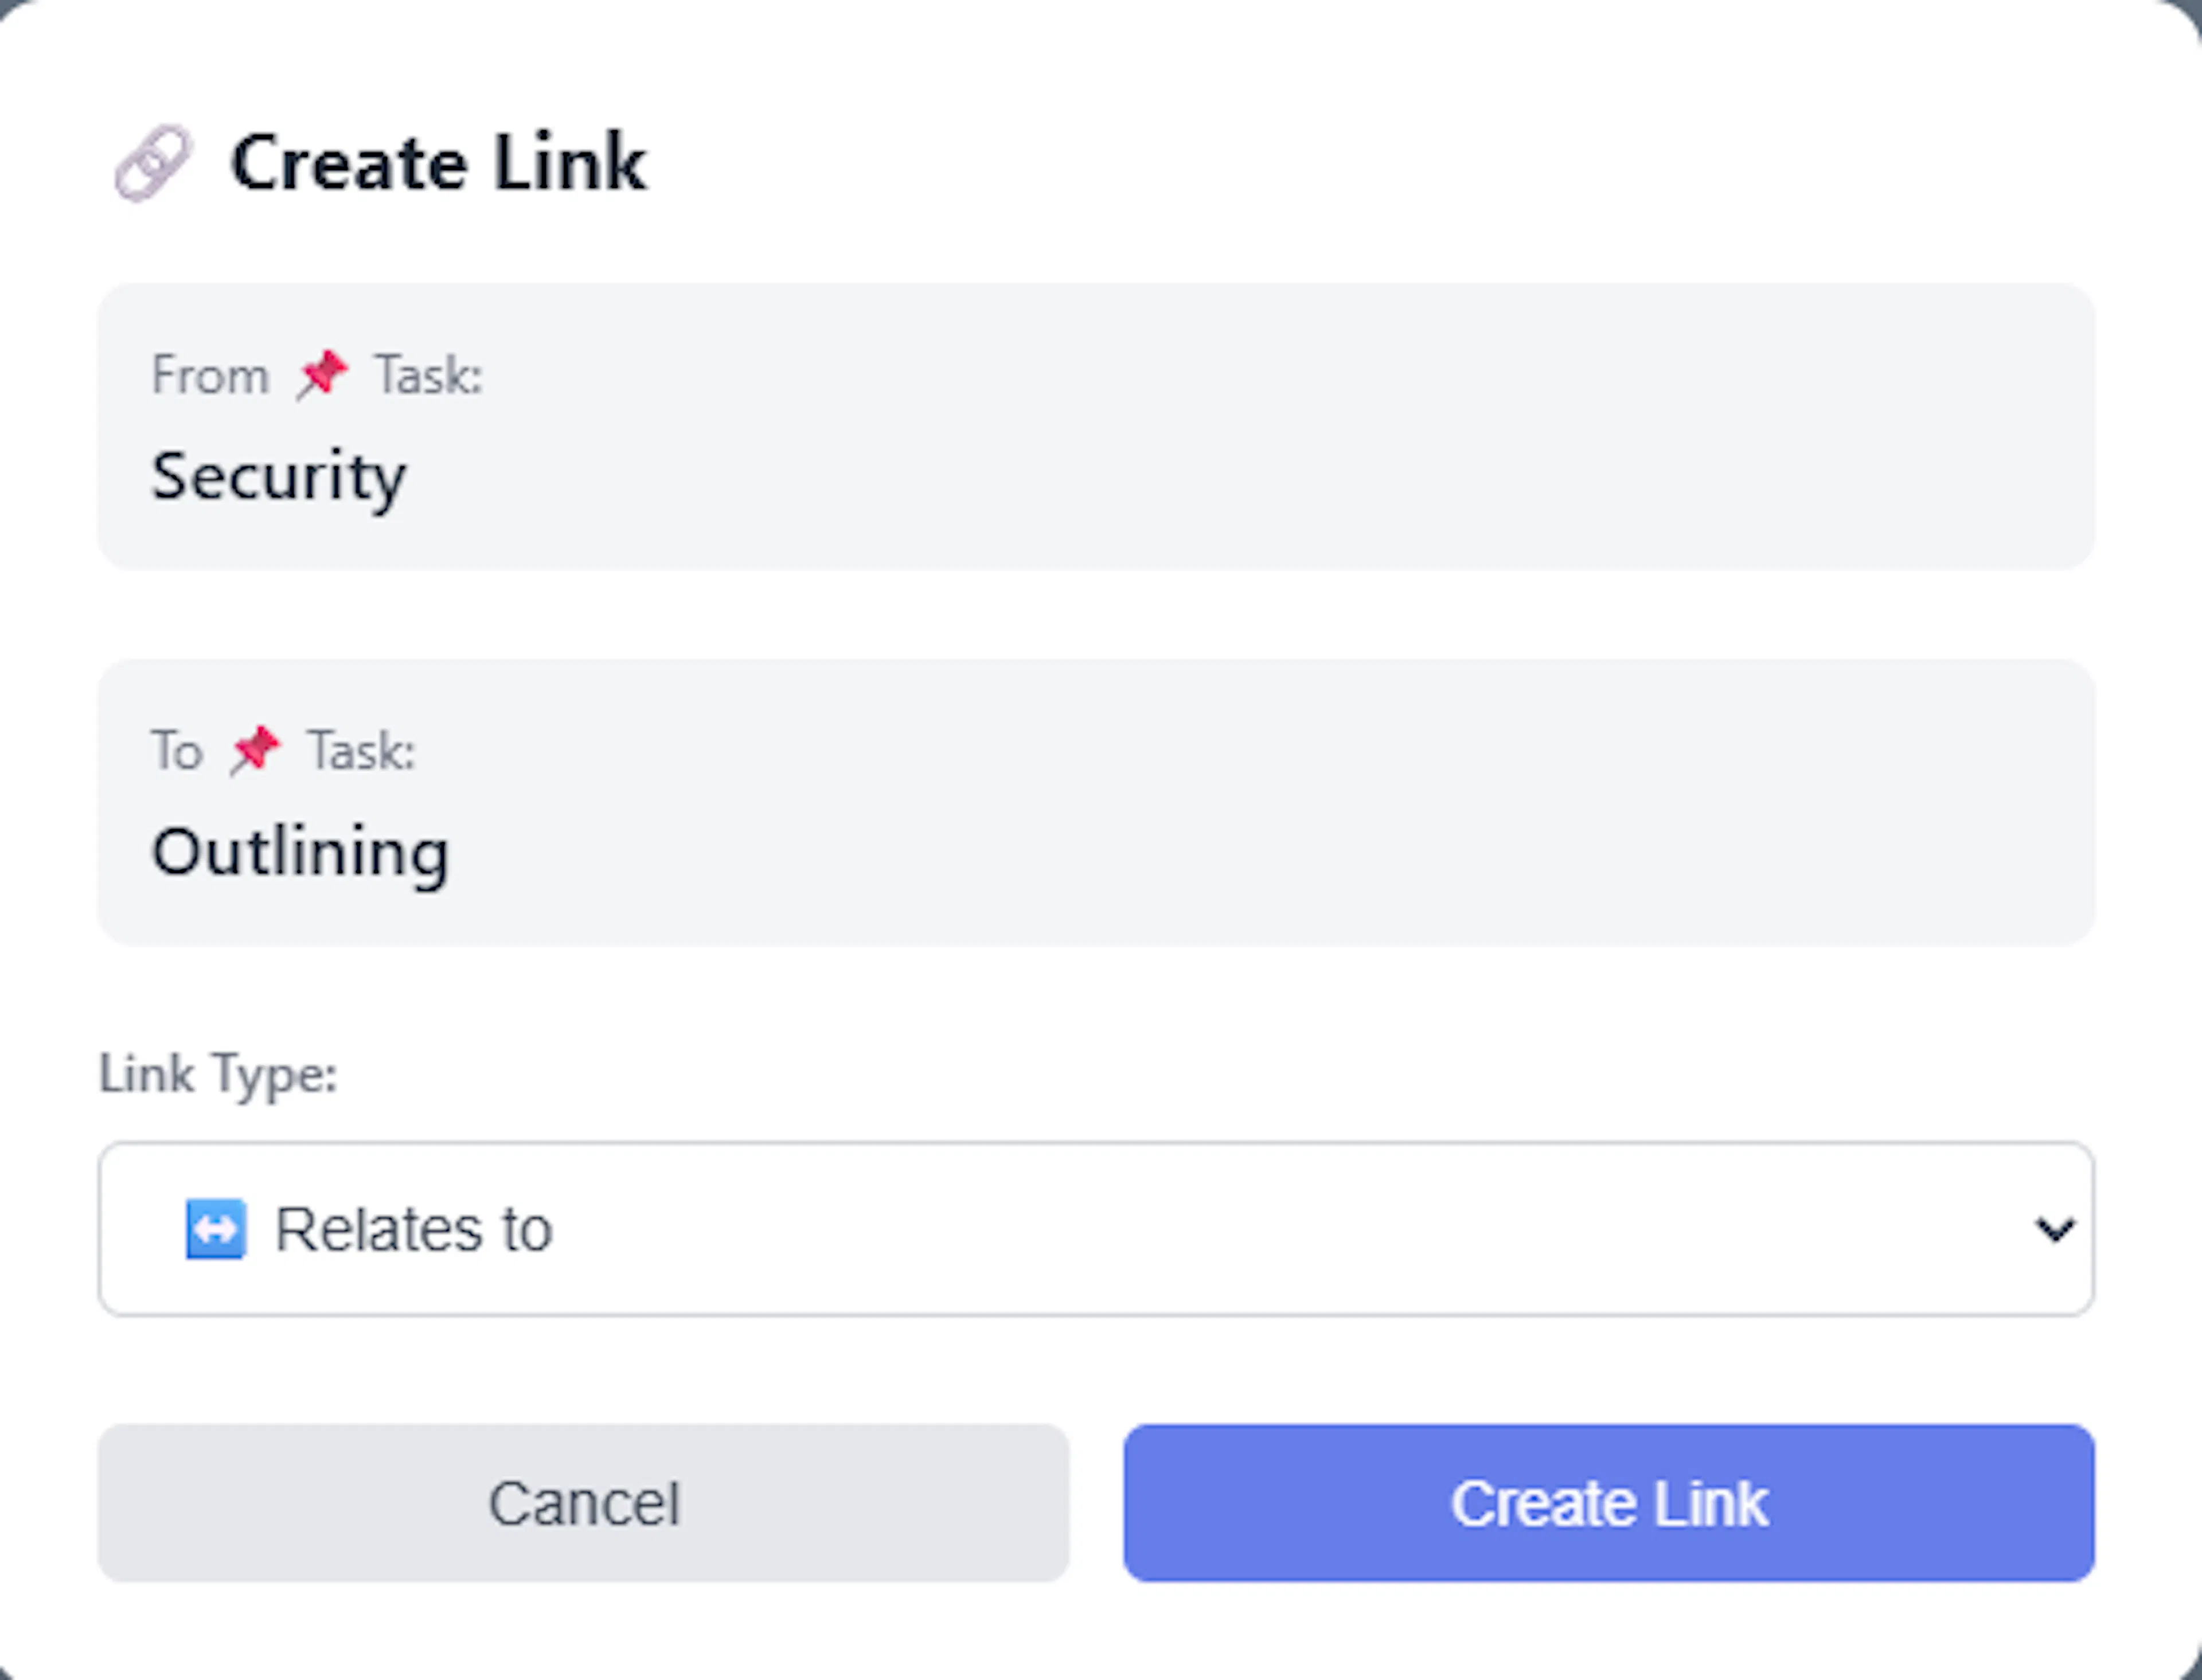
Link Types and Their Meanings When creating a link, you must choose a relationship type. Each type uses a distinct visual language to help you quickly read the map:
-
Relates to: A standard connection indicating the tasks are associated. Rendered as a blue/purple dashed line.
-
Depends on: Indicates the source task relies on the target task. Rendered as an amber/orange dotted line.
-
Blocks: Indicates the source task is actively preventing the target task from progressing. Rendered as a thick, red line with longer dashes.
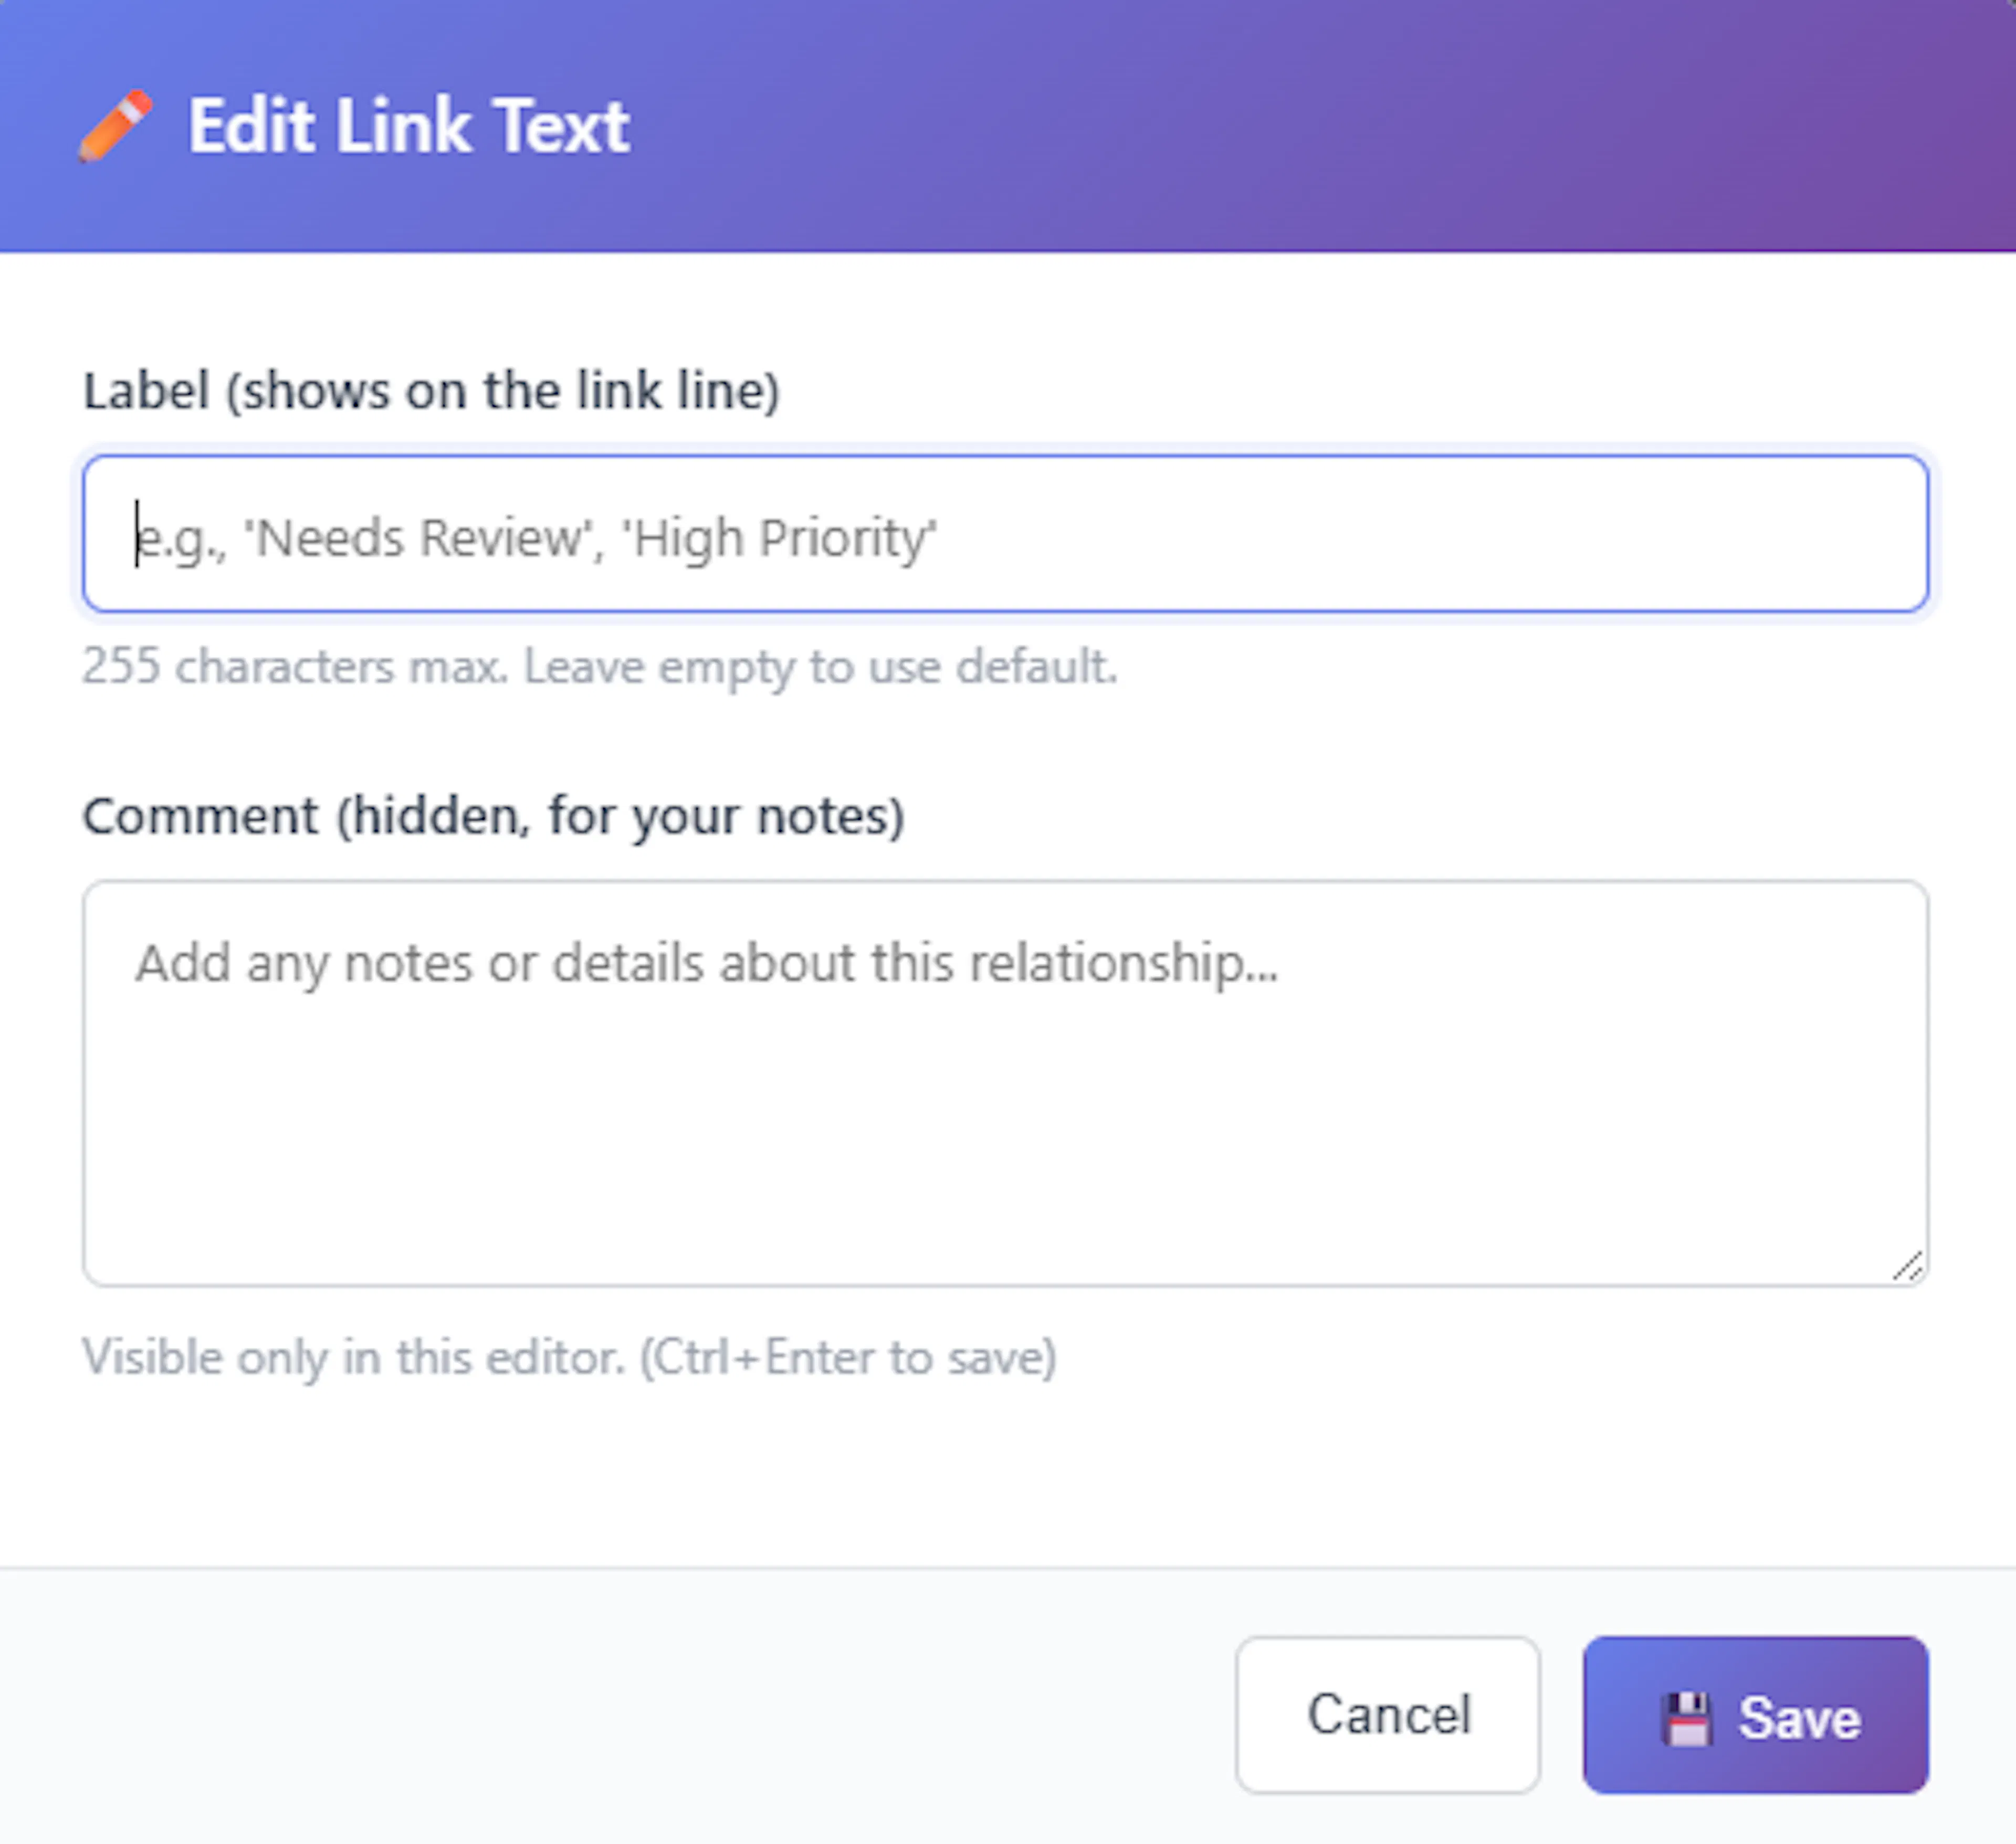
Editing Link Text and Comments: Links can carry their own descriptive labels and extended notes. To edit these, right-click directly on the link line to open its specific context menu and select Edit Link Text.
-
Label (Title): This text is rendered directly onto the link line on your canvas (up to 255 characters). If left empty, the system defaults to displaying the link type in uppercase (e.g., "RELATES TO").
-
Comment: This is a hidden text area for your personal notes regarding the dependency.
-
Hover Tooltips: To view a link's comment without opening the editor, simply hover your mouse over the link line. A tooltip will appear displaying the label and the full comment text.
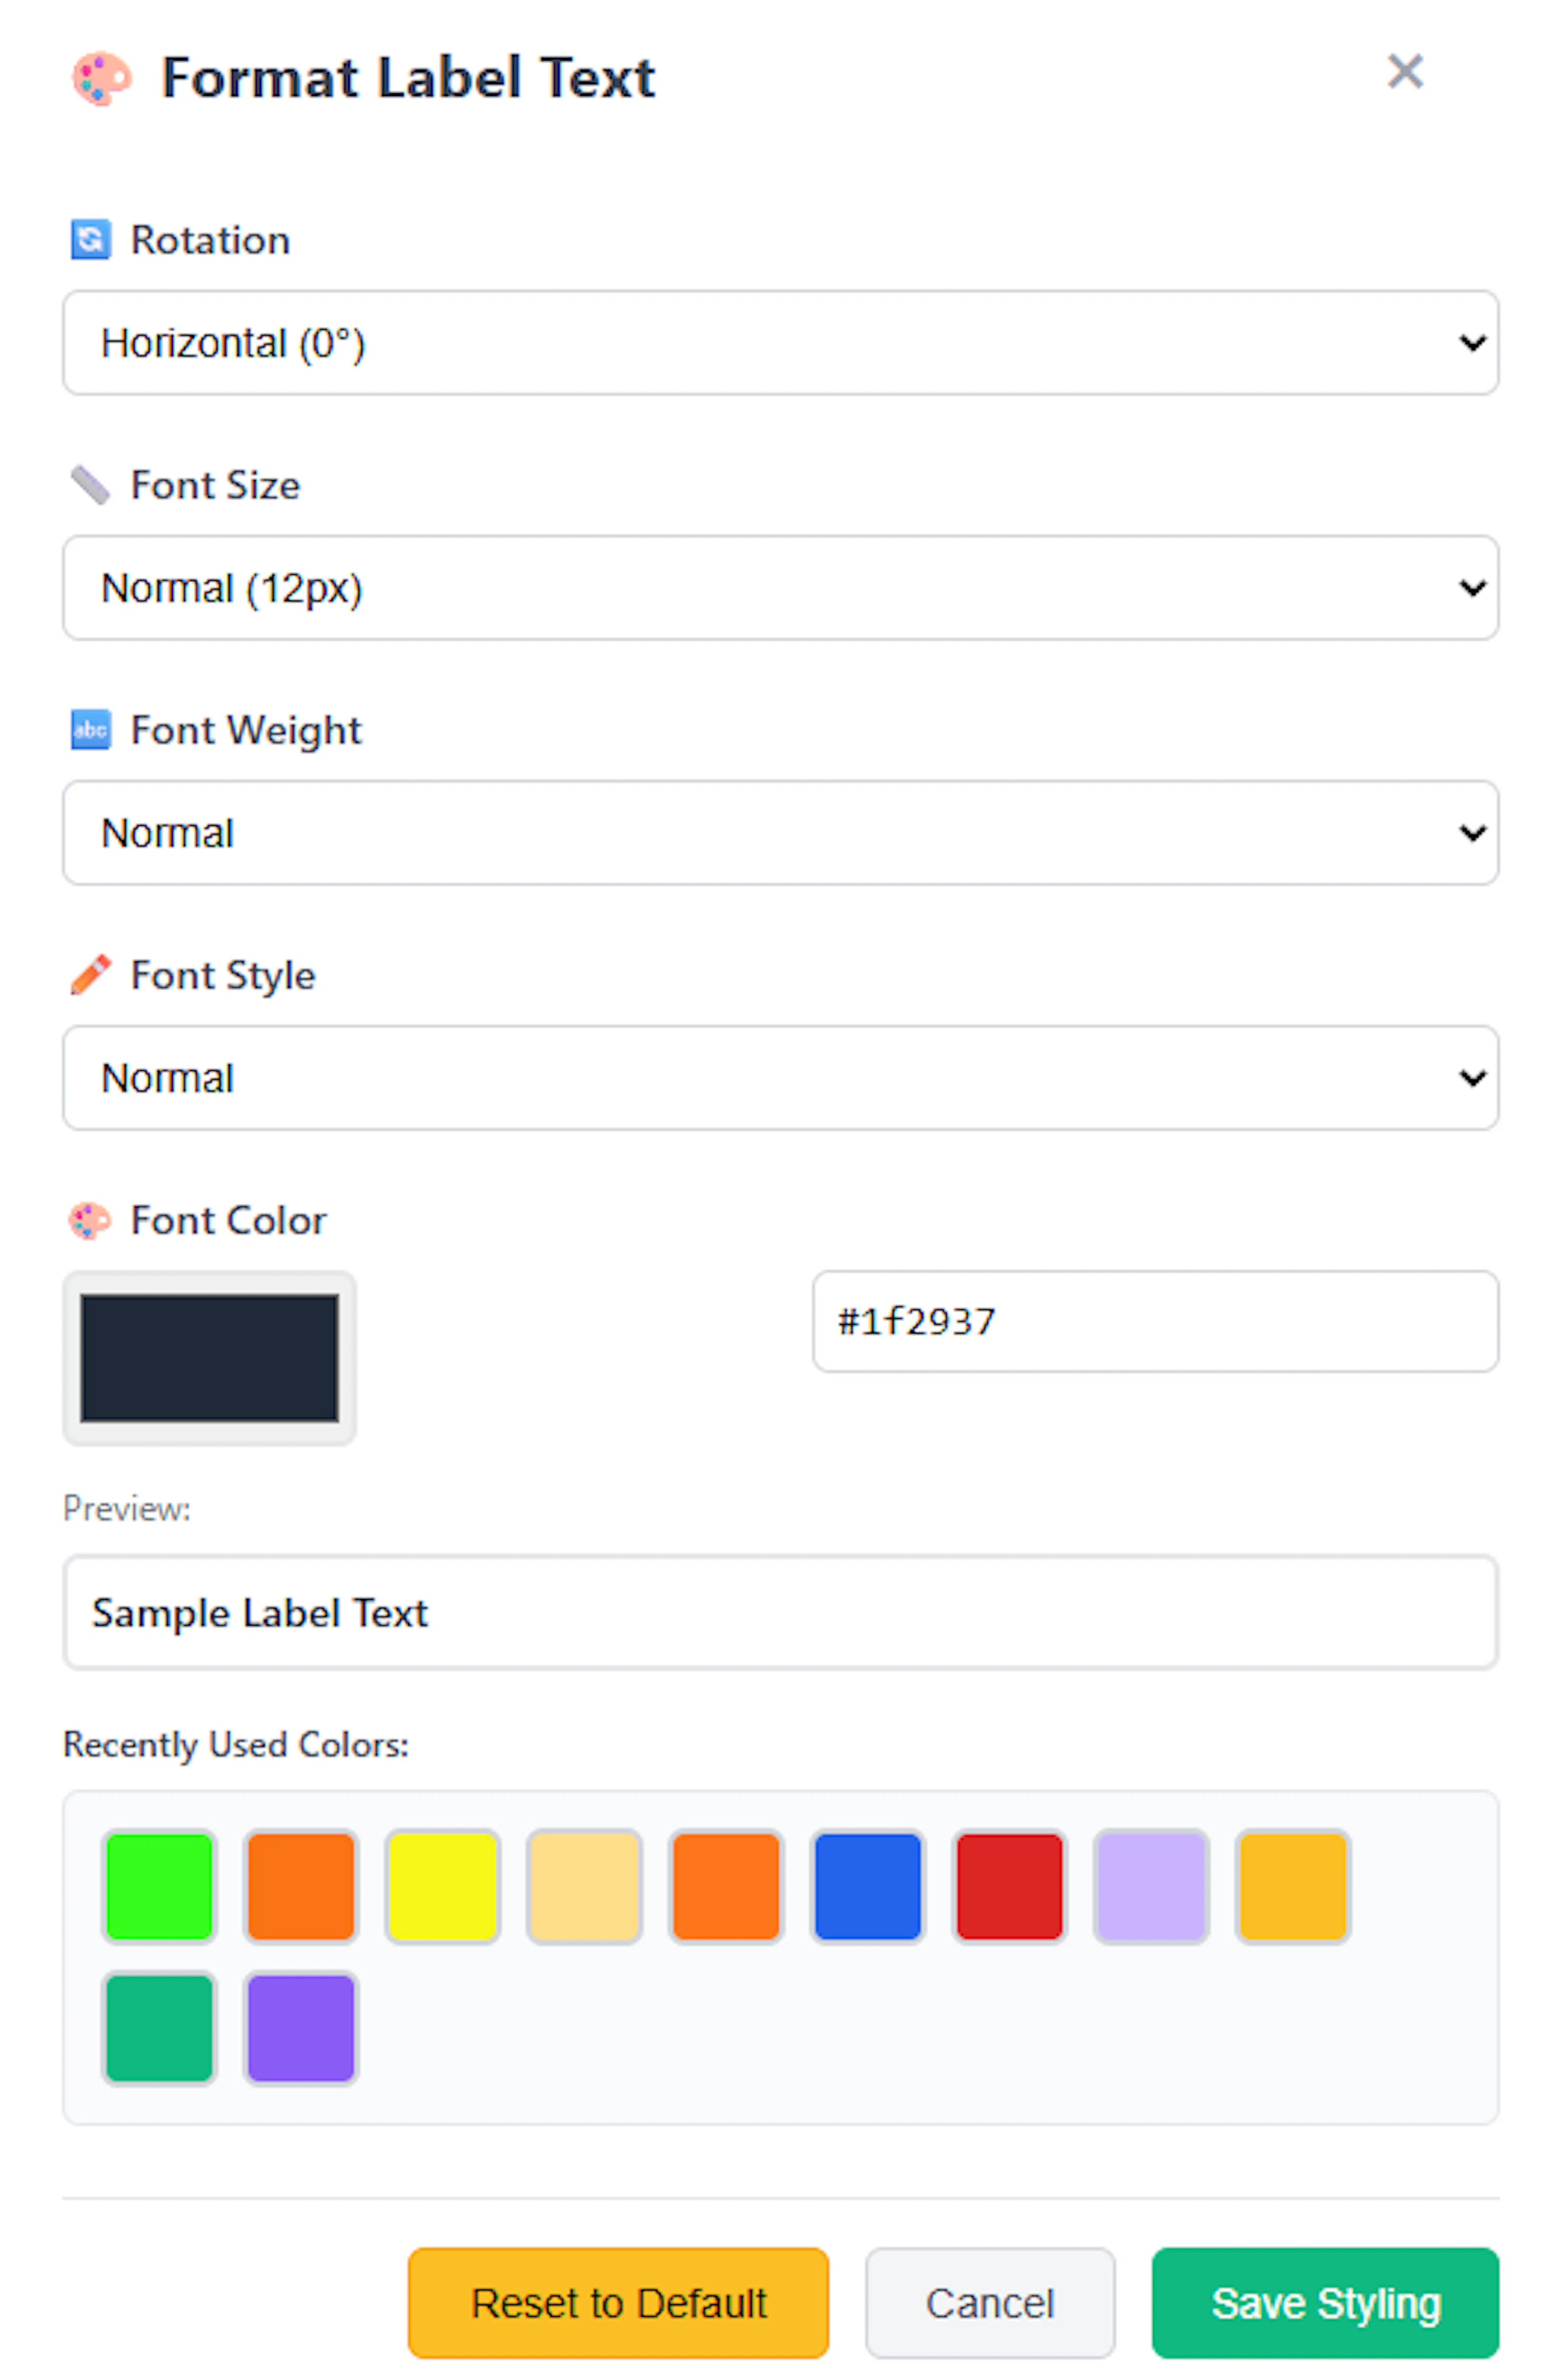
Formatting Label Text You have complete control over how the text label appears on the canvas. Right-click the link line and select Format Label Text to open the styling modal. From here, you can customise the following:
-
Font Size: Choose between Small (10px), Normal (12px), or Large (14px).
-
Font Style & Weight: Toggle standard, bold, or italic formatting.
-
Font Colour: Use the visual colour picker or paste a specific hex code to change the text colour.
-
Rotation: You can force the text to render Aligned with Line, horizontally (0°), diagonally right (45°), or diagonally left (-45°).
Dragging Text and Dynamic Alignment Link labels are fully interactive. You can click and drag the text label to reposition it anywhere along the curve of the line or offset it entirely.
If you set the label's rotation setting to Align with line, the system will perform dynamic geometry calculations. Wherever you drag and drop the text, the app will calculate the exact angle of the line's curve at that specific coordinate and seamlessly rotate the text so it perfectly follows the tangent of the line.
Arrow Directions: By default, link lines flow from your starting node to your target node. To change this, right-click the link and select Arrow Direction. You can choose between the following:
-
Forward: Arrow points from source to destination.
-
Reverse: Arrow points from destination to source.
-
Both: Double-headed arrows (↔) pointing in both directions.
Global Line Styles You can change the physical geometry of all custom links across your map using the Link Style dropdown located in the top input menu. The available routing styles are:
-
Elbow: Right-angle turns (horizontal then vertical).
-
Straight (Linear): Direct, straight diagonal lines connecting the nodes.
-
Vertical Bump: A smooth curve that extends horizontally before dropping vertically.
-
Cardinal Curve & Catmull Rom: Different mathematical variations of smooth, sweeping bezier curves.
Shaping Lines with Control Handles If you select one of the curved link styles (Vertical Bump, Cardinal, or Catmull), you can manually sculpt the exact shape of the curve.
-
Single-click on any curved link line.
-
Two circular control points (handles) will appear along the path.
-
Click and drag these handles horizontally to stretch, bend, or flatten the curve to route the line exactly around other nodes.
-
Once you are satisfied with the shape, click anywhere on the empty canvas background to hide the control handles.
Text Boxes
Text boxes are free-floating annotations on your mind map canvas that can carry text, icons, or a combination of both. They are perfect for adding general notes, contextual labels, or large visual markers that are not strictly tied to the task hierarchy.
Creating a Text Box To create a new text box, simply right-click on any empty area of the mind map canvas. From the canvas context menu, select the "Add Text Box" option. A new text box will be instantly generated at the exact coordinates where you clicked.
Adding Text and Formatting Editing a text box works similarly to editing a task node.
-
Select and Edit: Click the text box once to select it, then click it a second time to enter edit mode. This opens an inline text area where you can type your notes. To save your text, simply click anywhere outside the box.
-
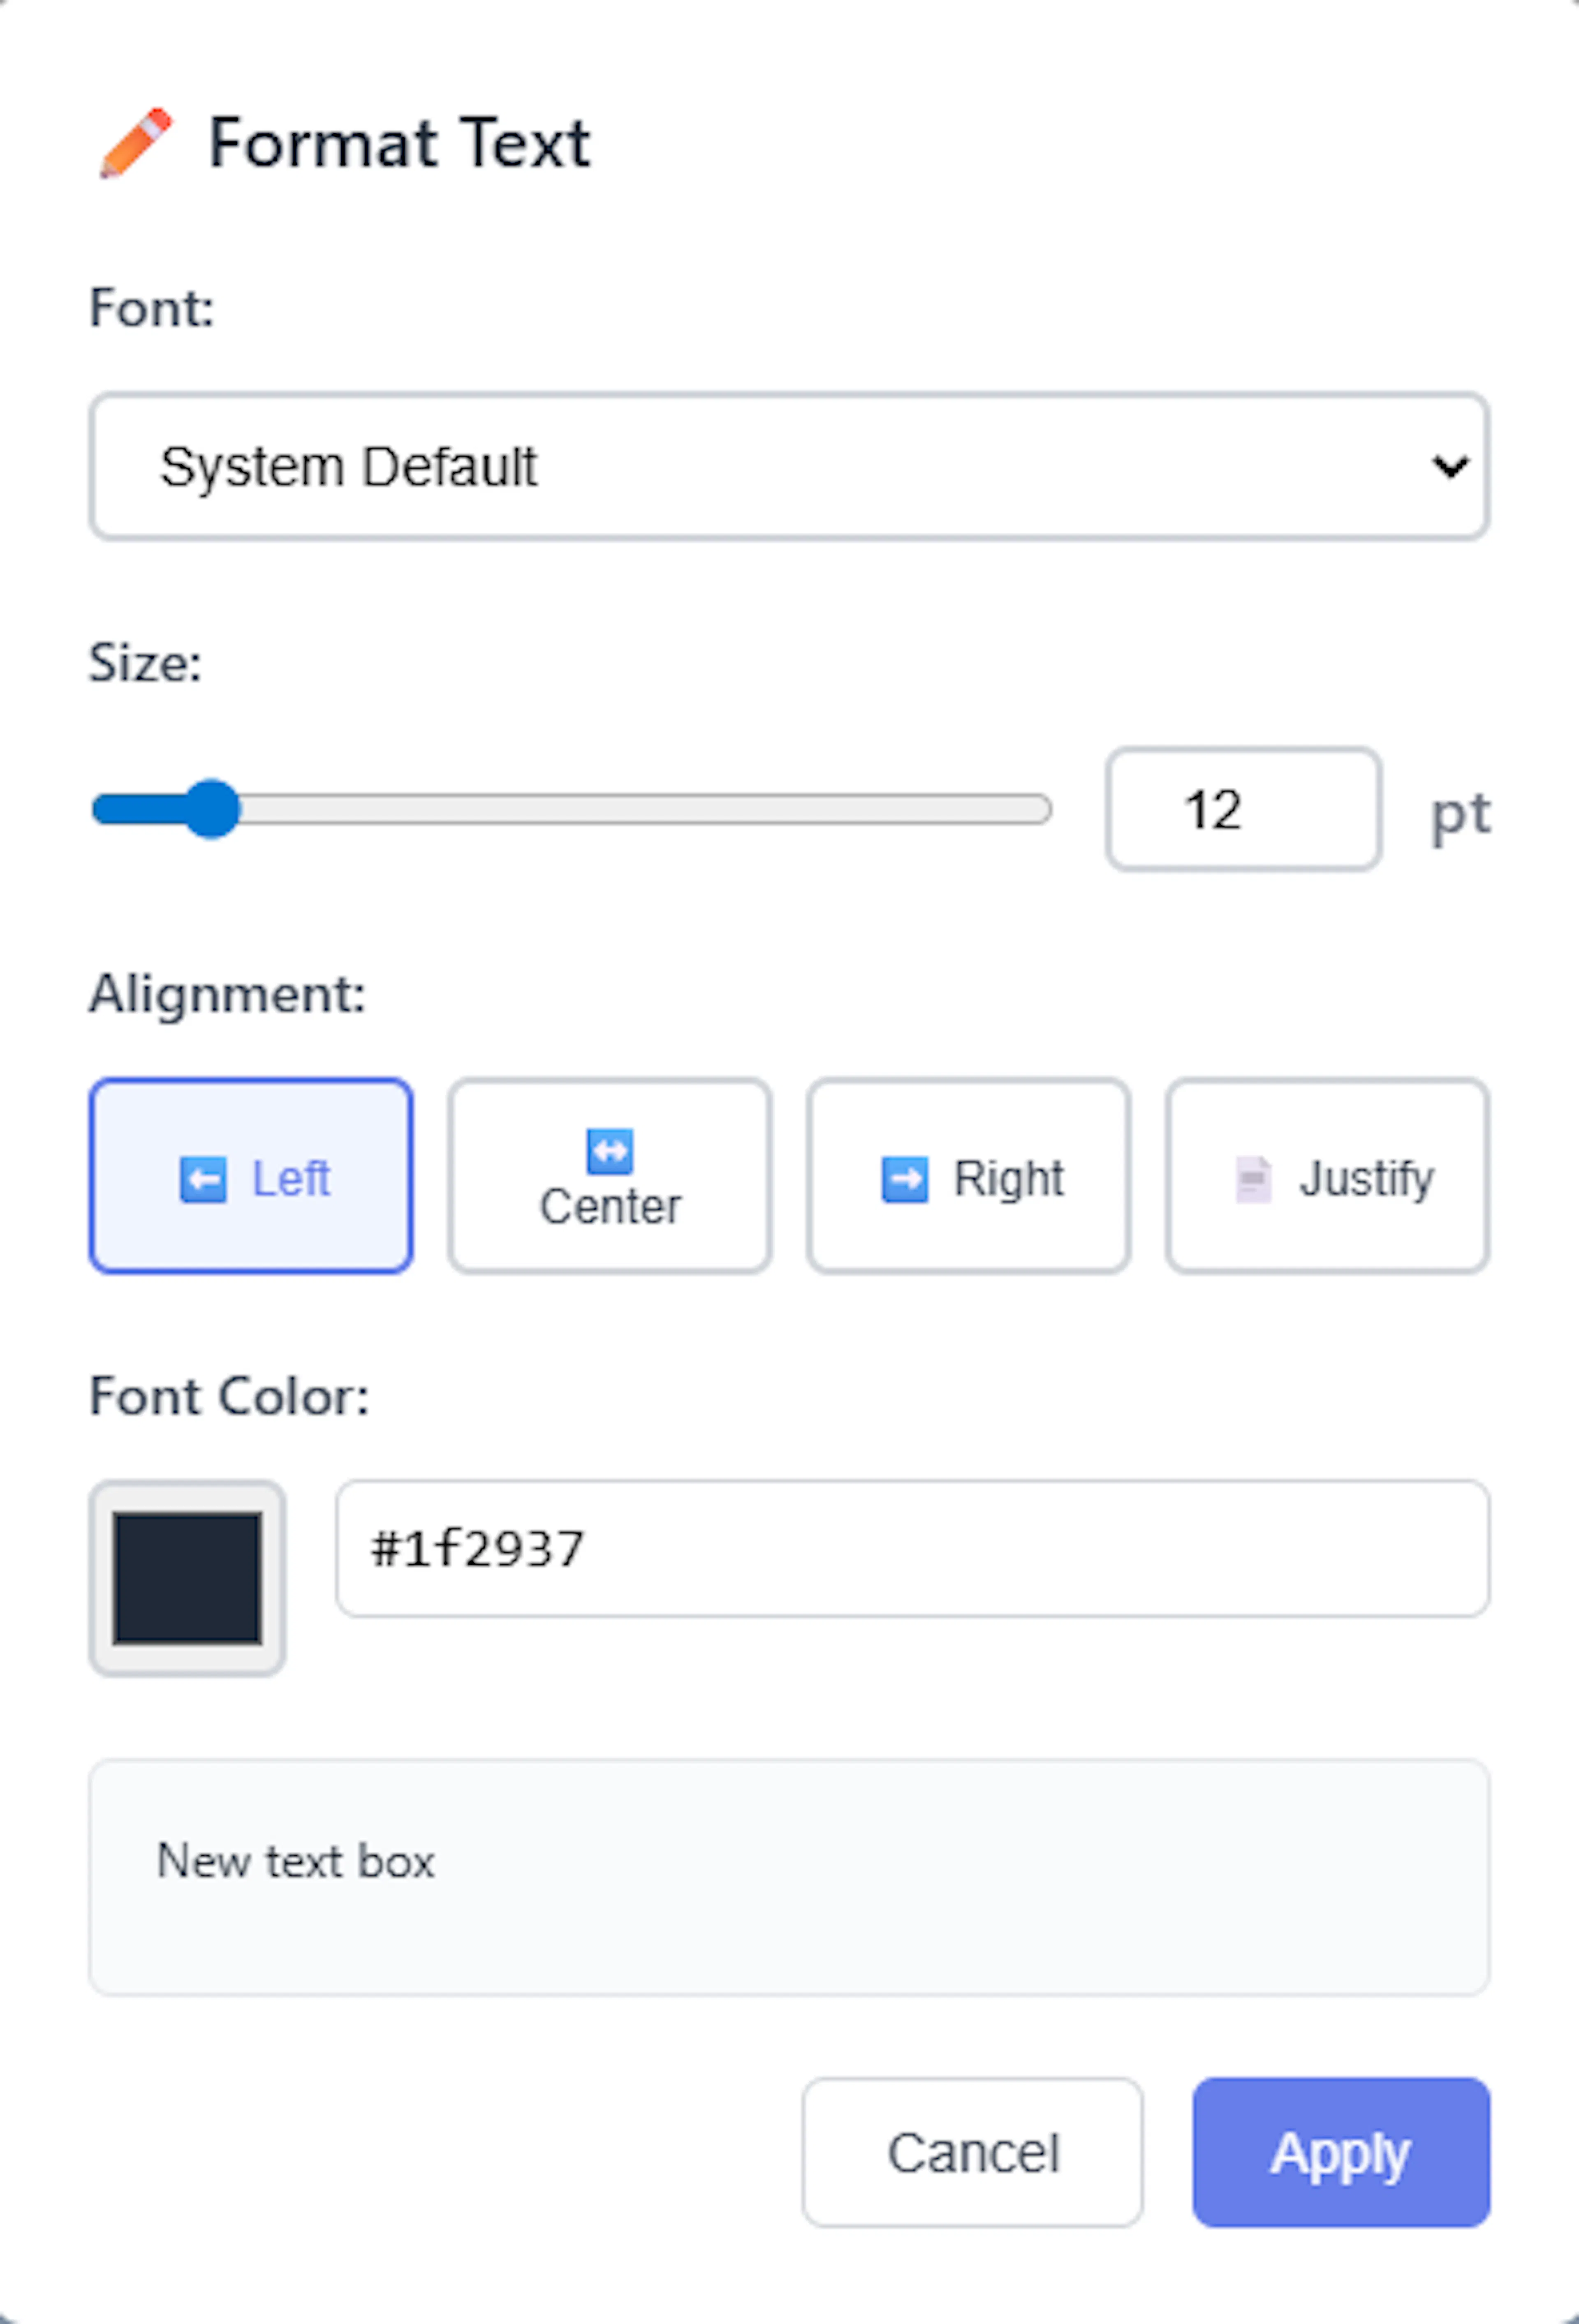
Format Text: To change the typography, right-click the text box and select "Format Text". This opens a styling menu where you can adjust the font family, size, weight, alignment, and text colour.
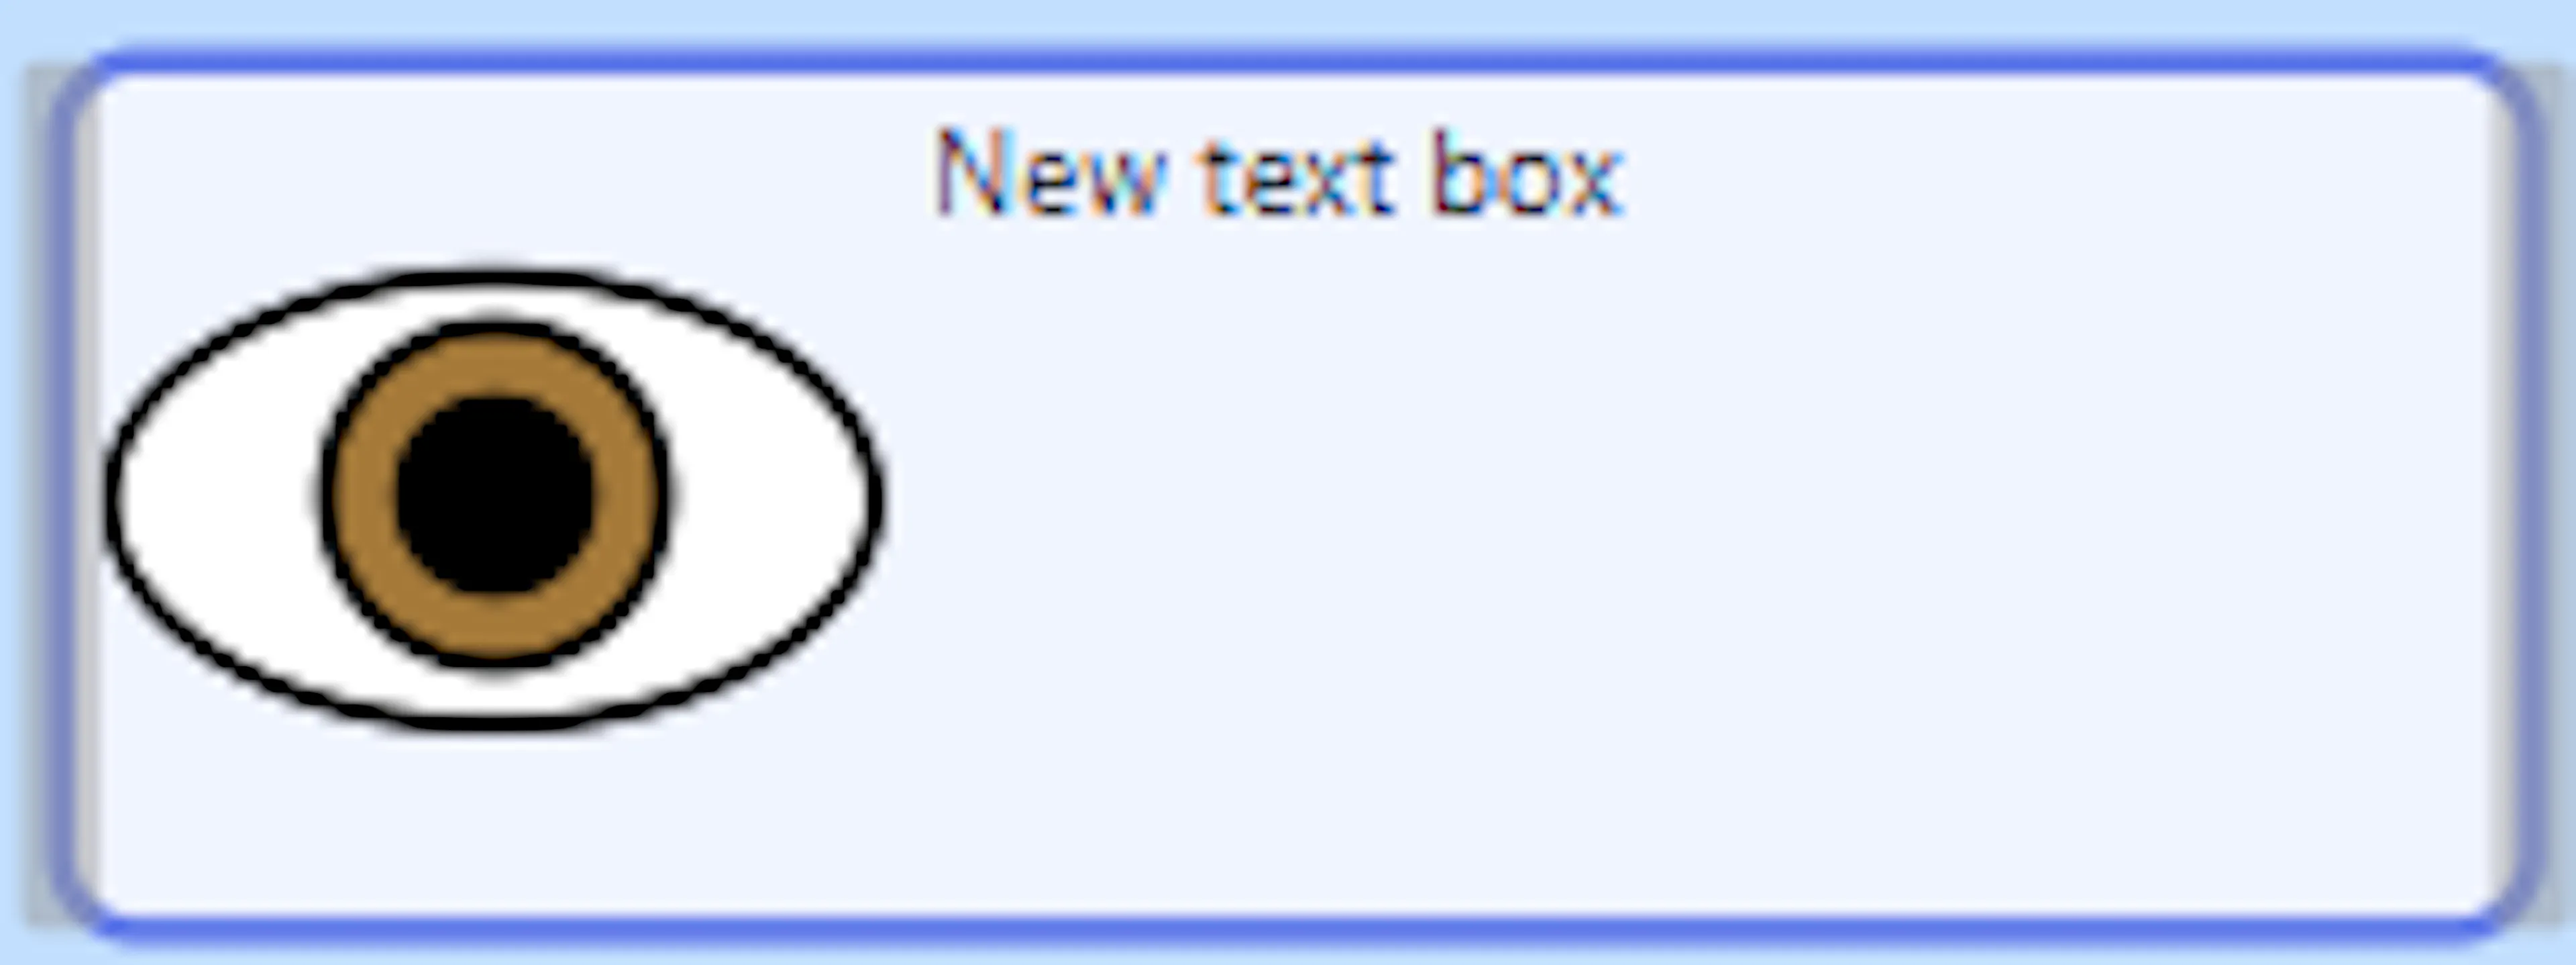
Adding Icons and Icon-Only Mode You can attach an icon to your text box to give it quick visual context.
- Applying an Icon: Right-click the text box and select "Change Icon" to open the standard Icon Picker modal. Once selected, a small version of the icon will appear in the top-left corner of the text box next to your text.
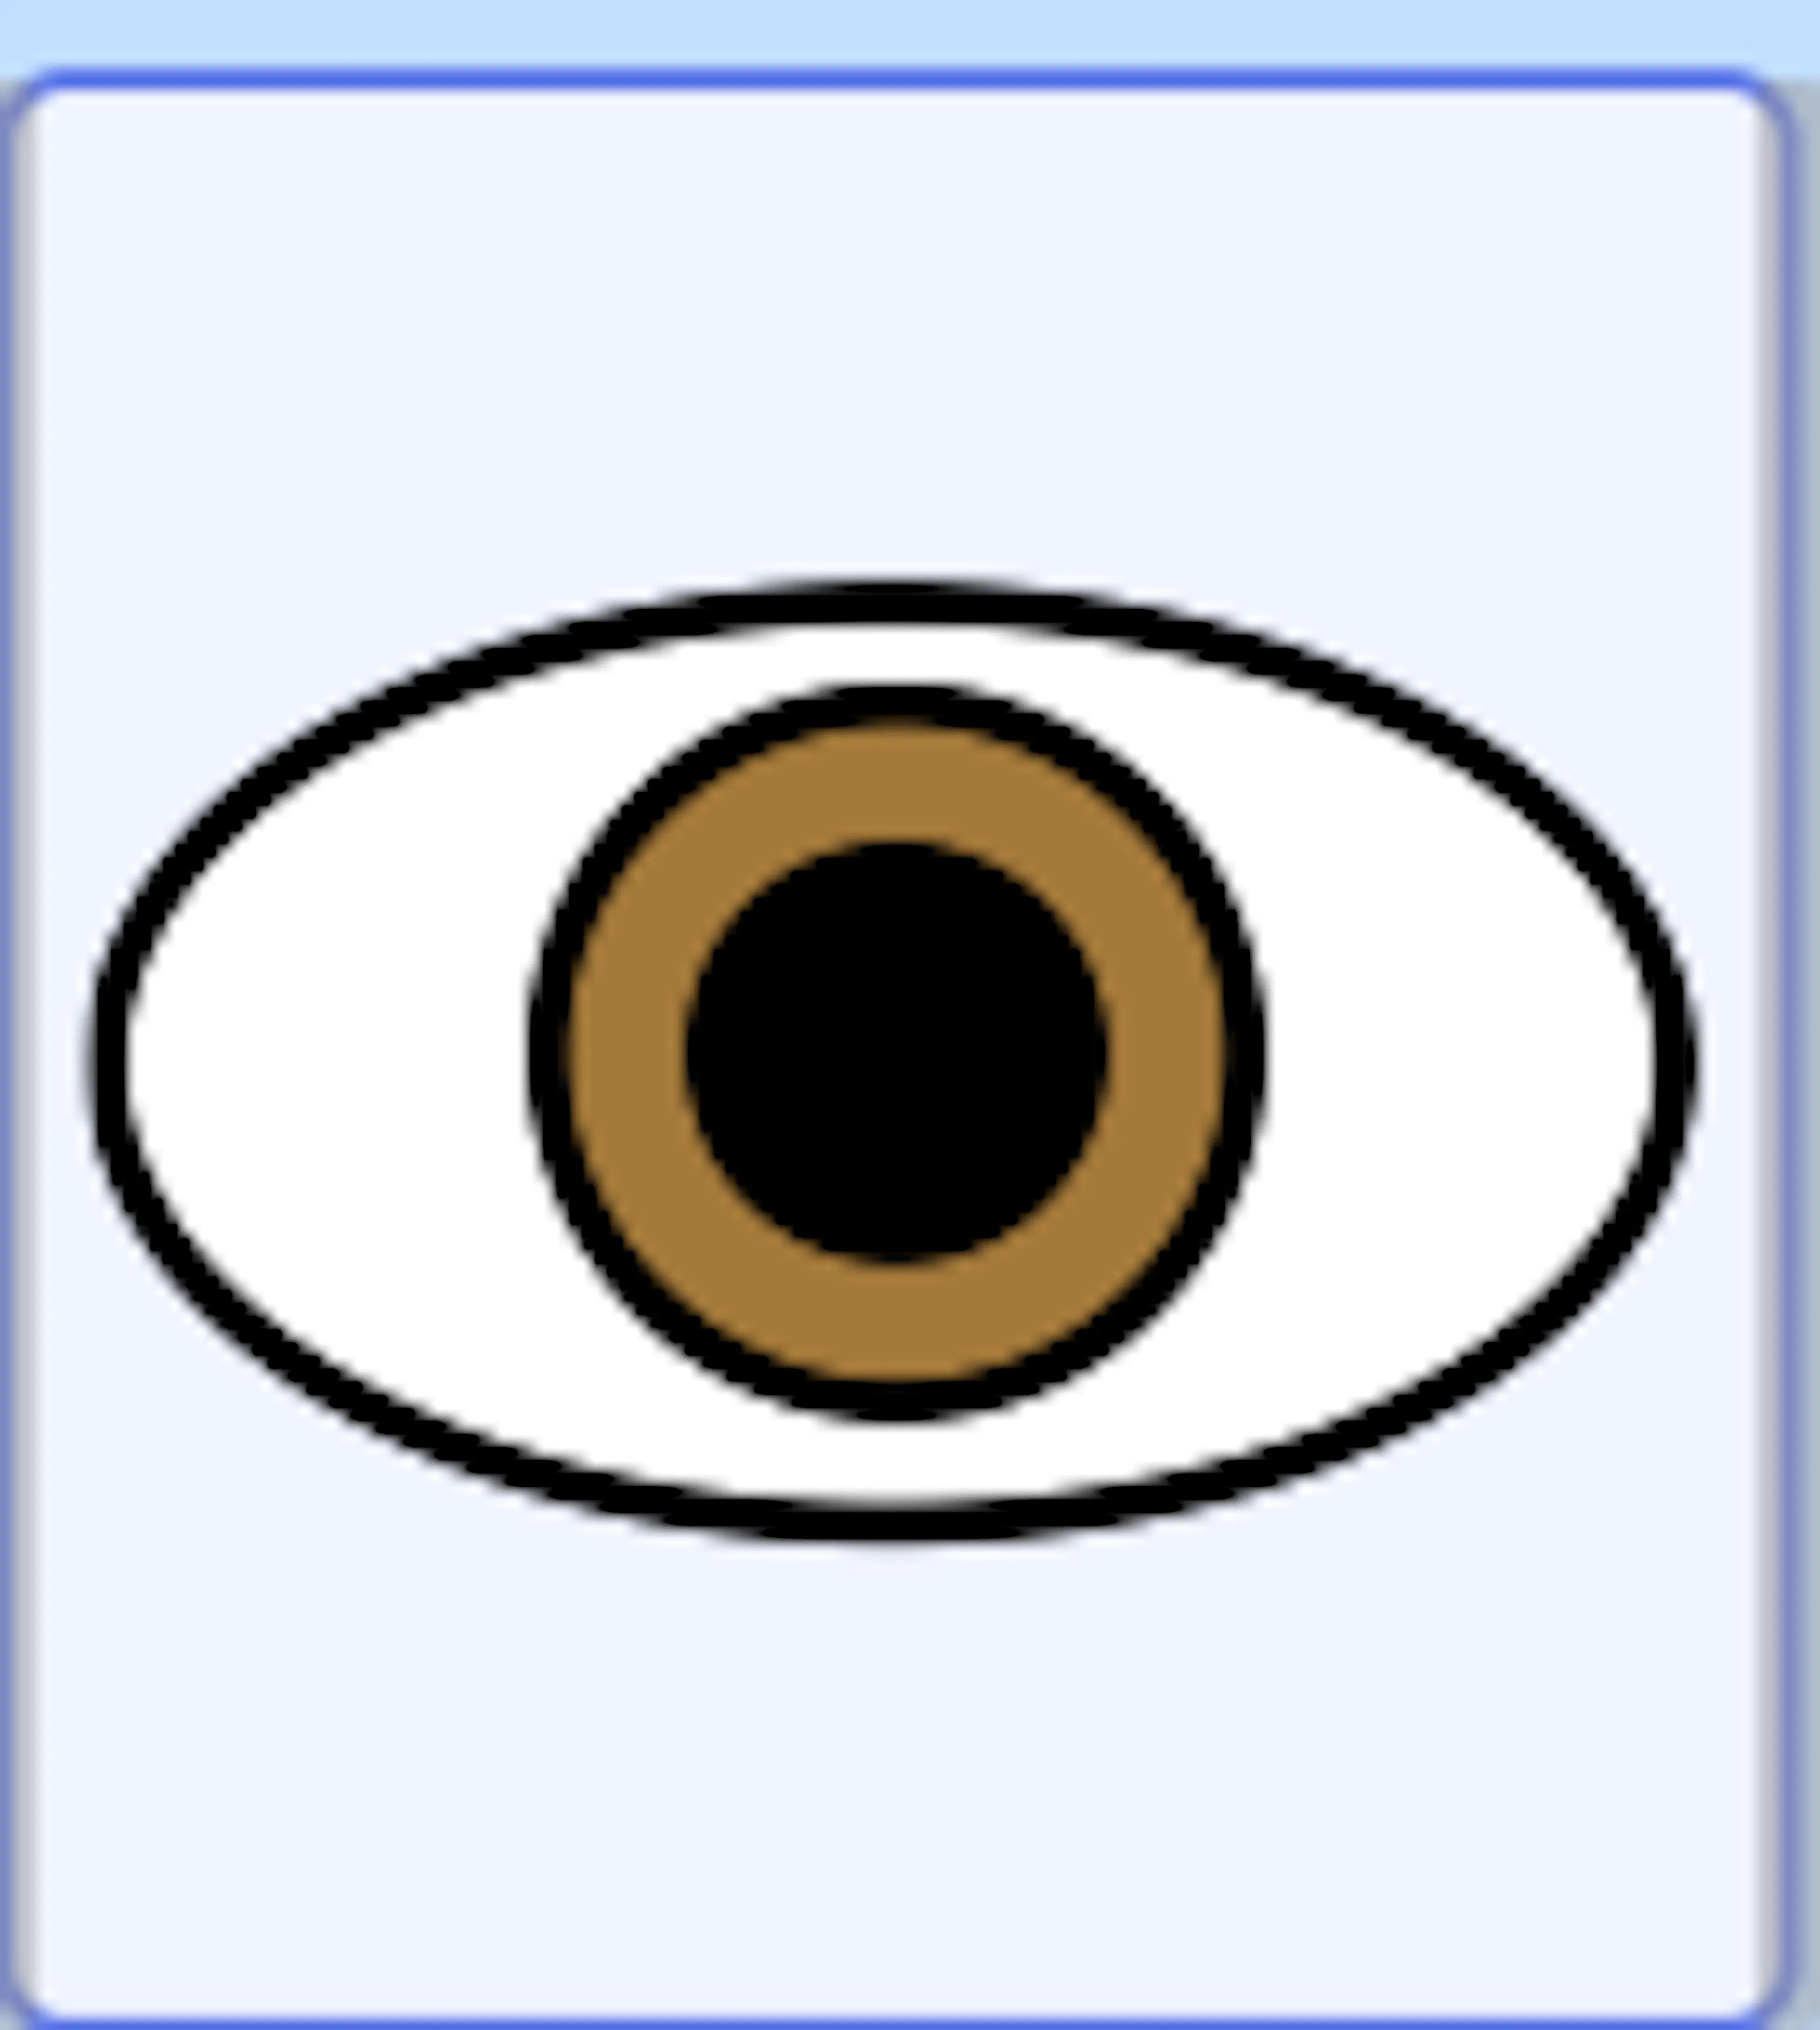
Icon-Only Mode: If you want a text box to act purely as a large visual marker, you can trigger "Icon-Only Mode." To do this, simply delete all the text inside the box while an icon is applied. The system will automatically detect the empty text and expand the box to display a large, 200px version of the icon centred in the frame. To revert this, right-click the large icon and select "Convert to Text Box", which will restore the text area.
Coloring Text Boxes To change the background colour of your text box, right-click it and select "Change Colour" to open the Text Box Colour Picker. You can select a colour using the visual picker, enter a Hex code, or choose from your recently used colours.
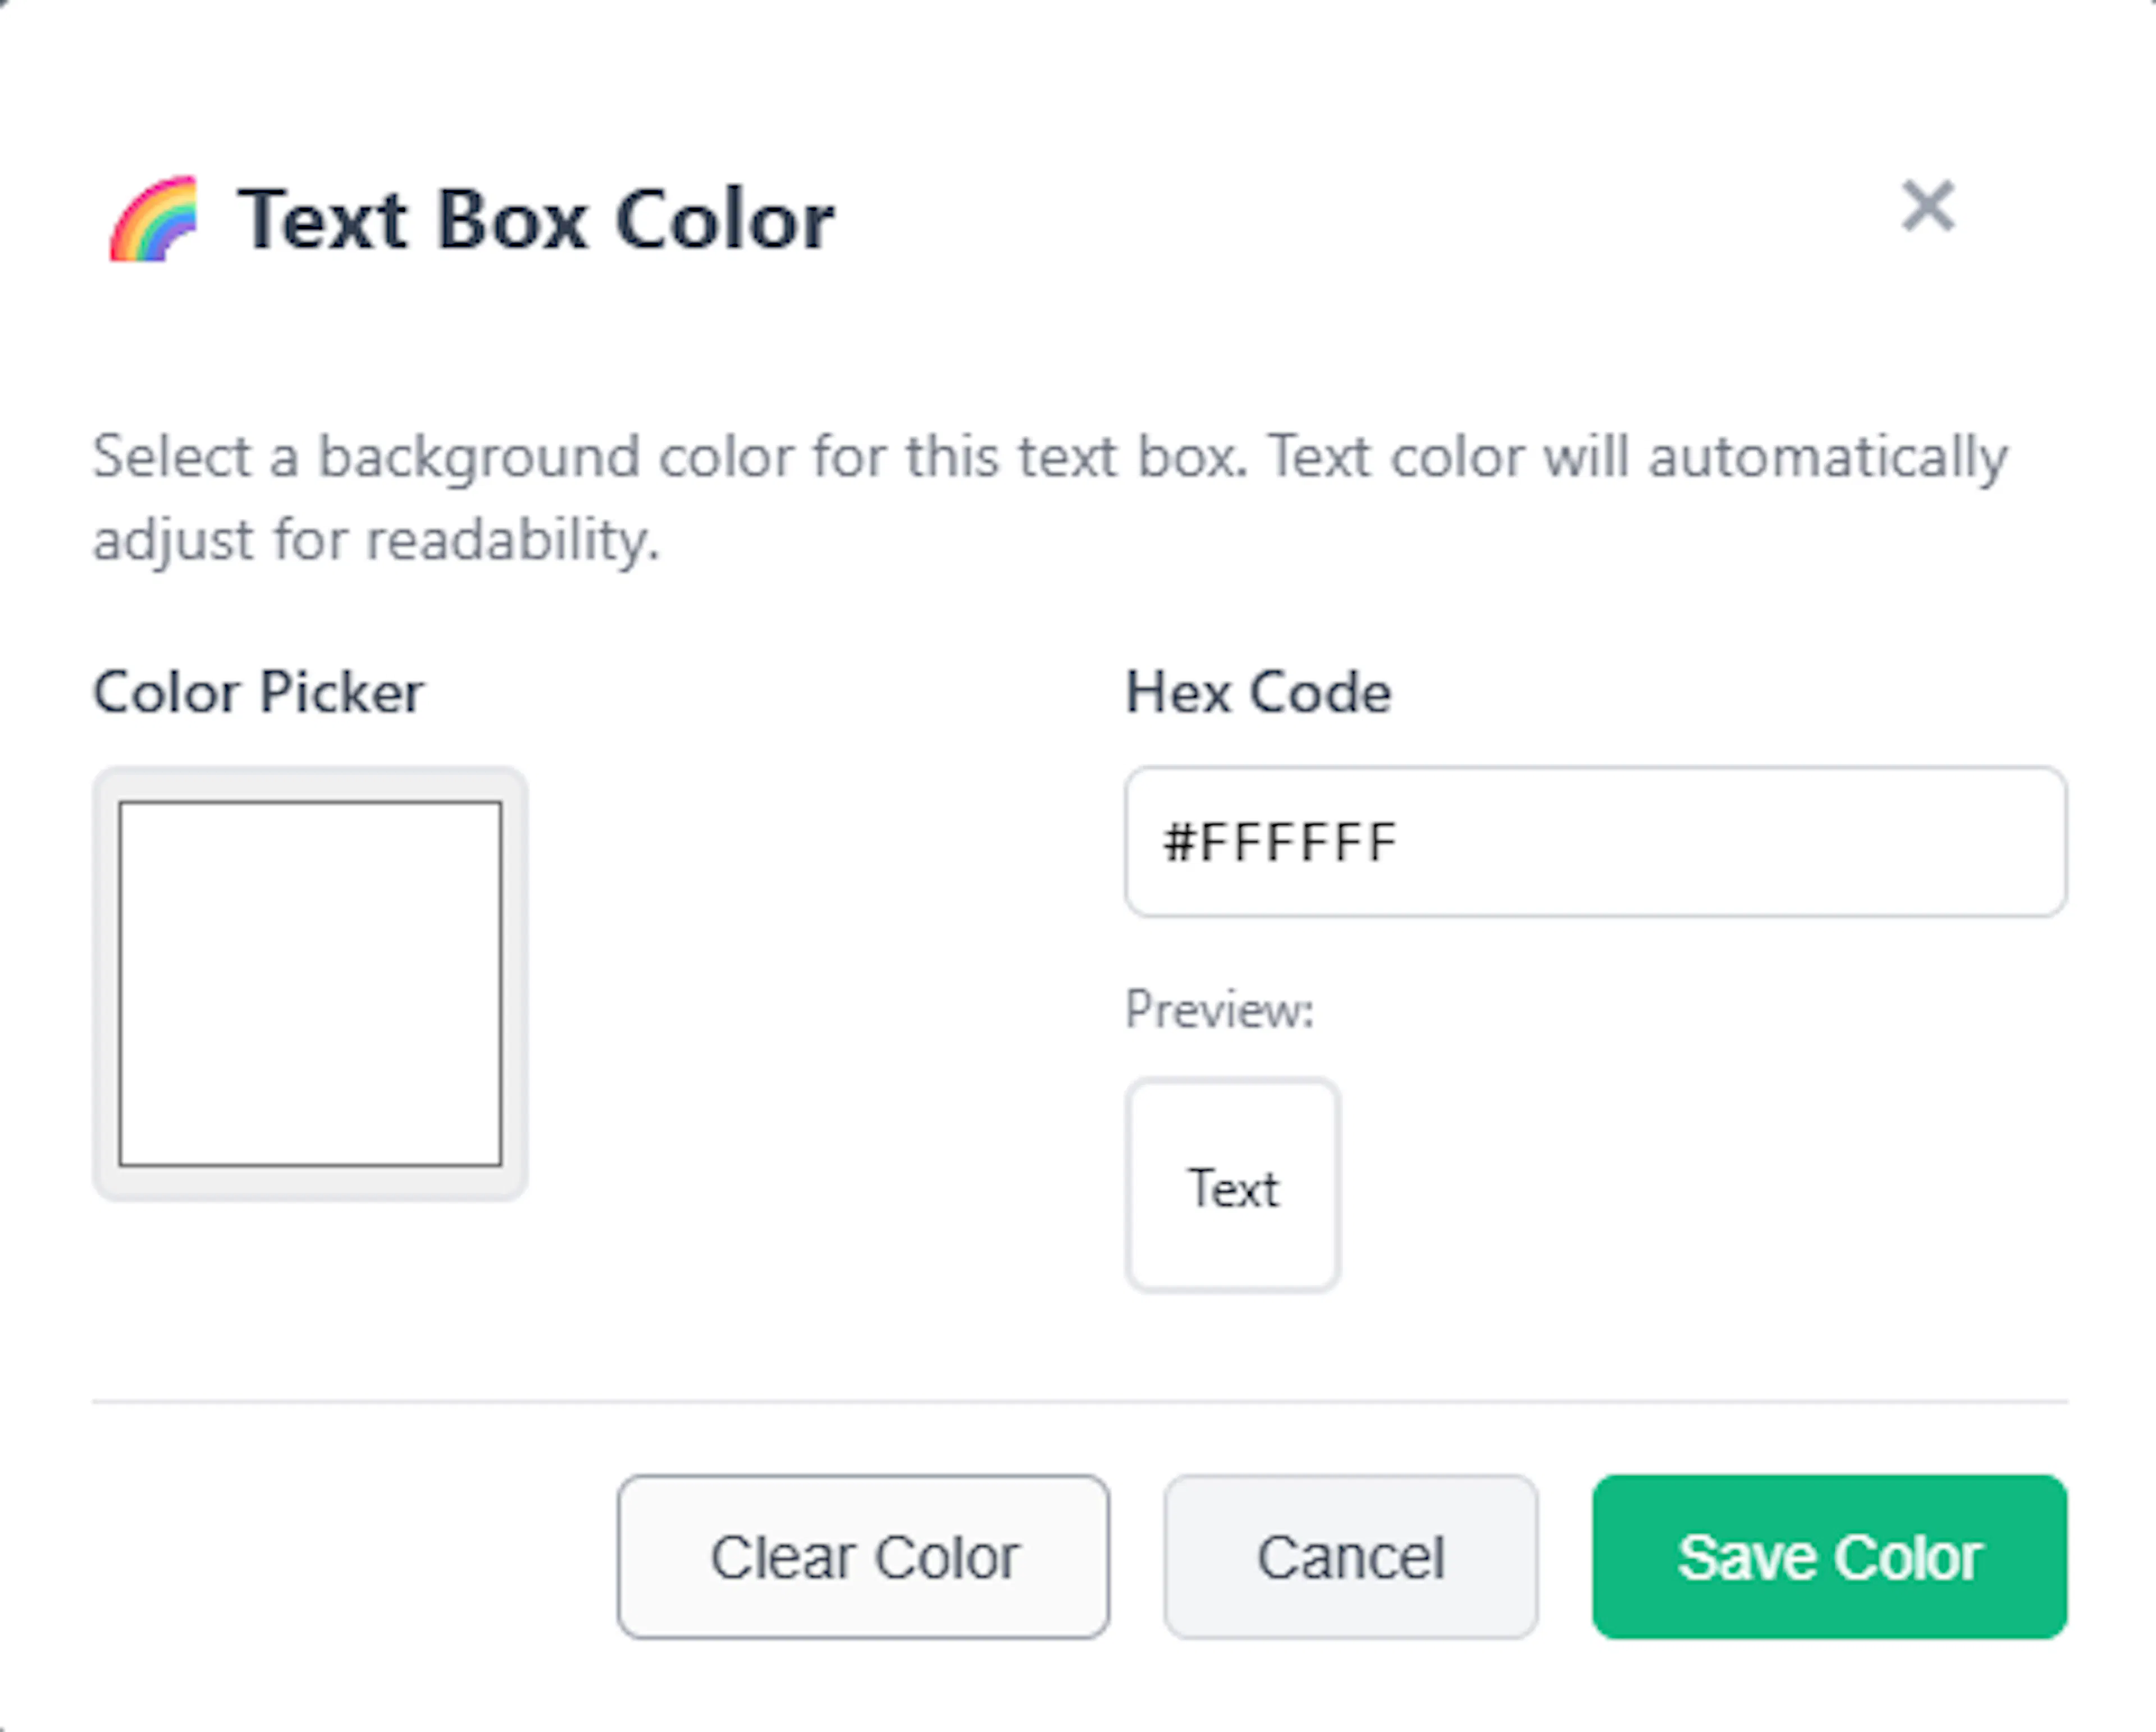
Mind Dump features an intelligent contrast system; when you apply a new background colour to a text box, the app automatically calculates the colour's luminance and adjusts the default text colour to either dark or white to ensure it remains perfectly readable.
Linking Text Boxes Text boxes do not need to remain isolated; you can draw arbitrary link lines to connect them to other elements on the map. Right-click the text box, select "Add Link", and then click on any task node or another text box to establish a connection. These lines function exactly like task-to-task links, complete with customisable line styles, relationship labels, and directional arrows.
Moving and Resizing
-
Moving: Text boxes are fully draggable. Simply click and hold anywhere on the text box (when it is not in edit mode) and drag your mouse to freely reposition it across the infinite canvas. Any connected link lines will dynamically follow the box as it moves.
-
Resizing: If you need more horizontal space for your text, you can adjust the width of the box by clicking and dragging the resize handles located on its left and right vertical edges. As you resize the width, the box will automatically recalculate and adjust its height to ensure all text remains visible.
Customising Primary Branch Styles
While custom "Link Lines" (which you configure via the Link Style menu) connect arbitrary tasks across your map, your primary parent-child hierarchy is automatically connected by structural Branches. Mind Dump allows you to change the geometry of these main connections to suit your visual preference.
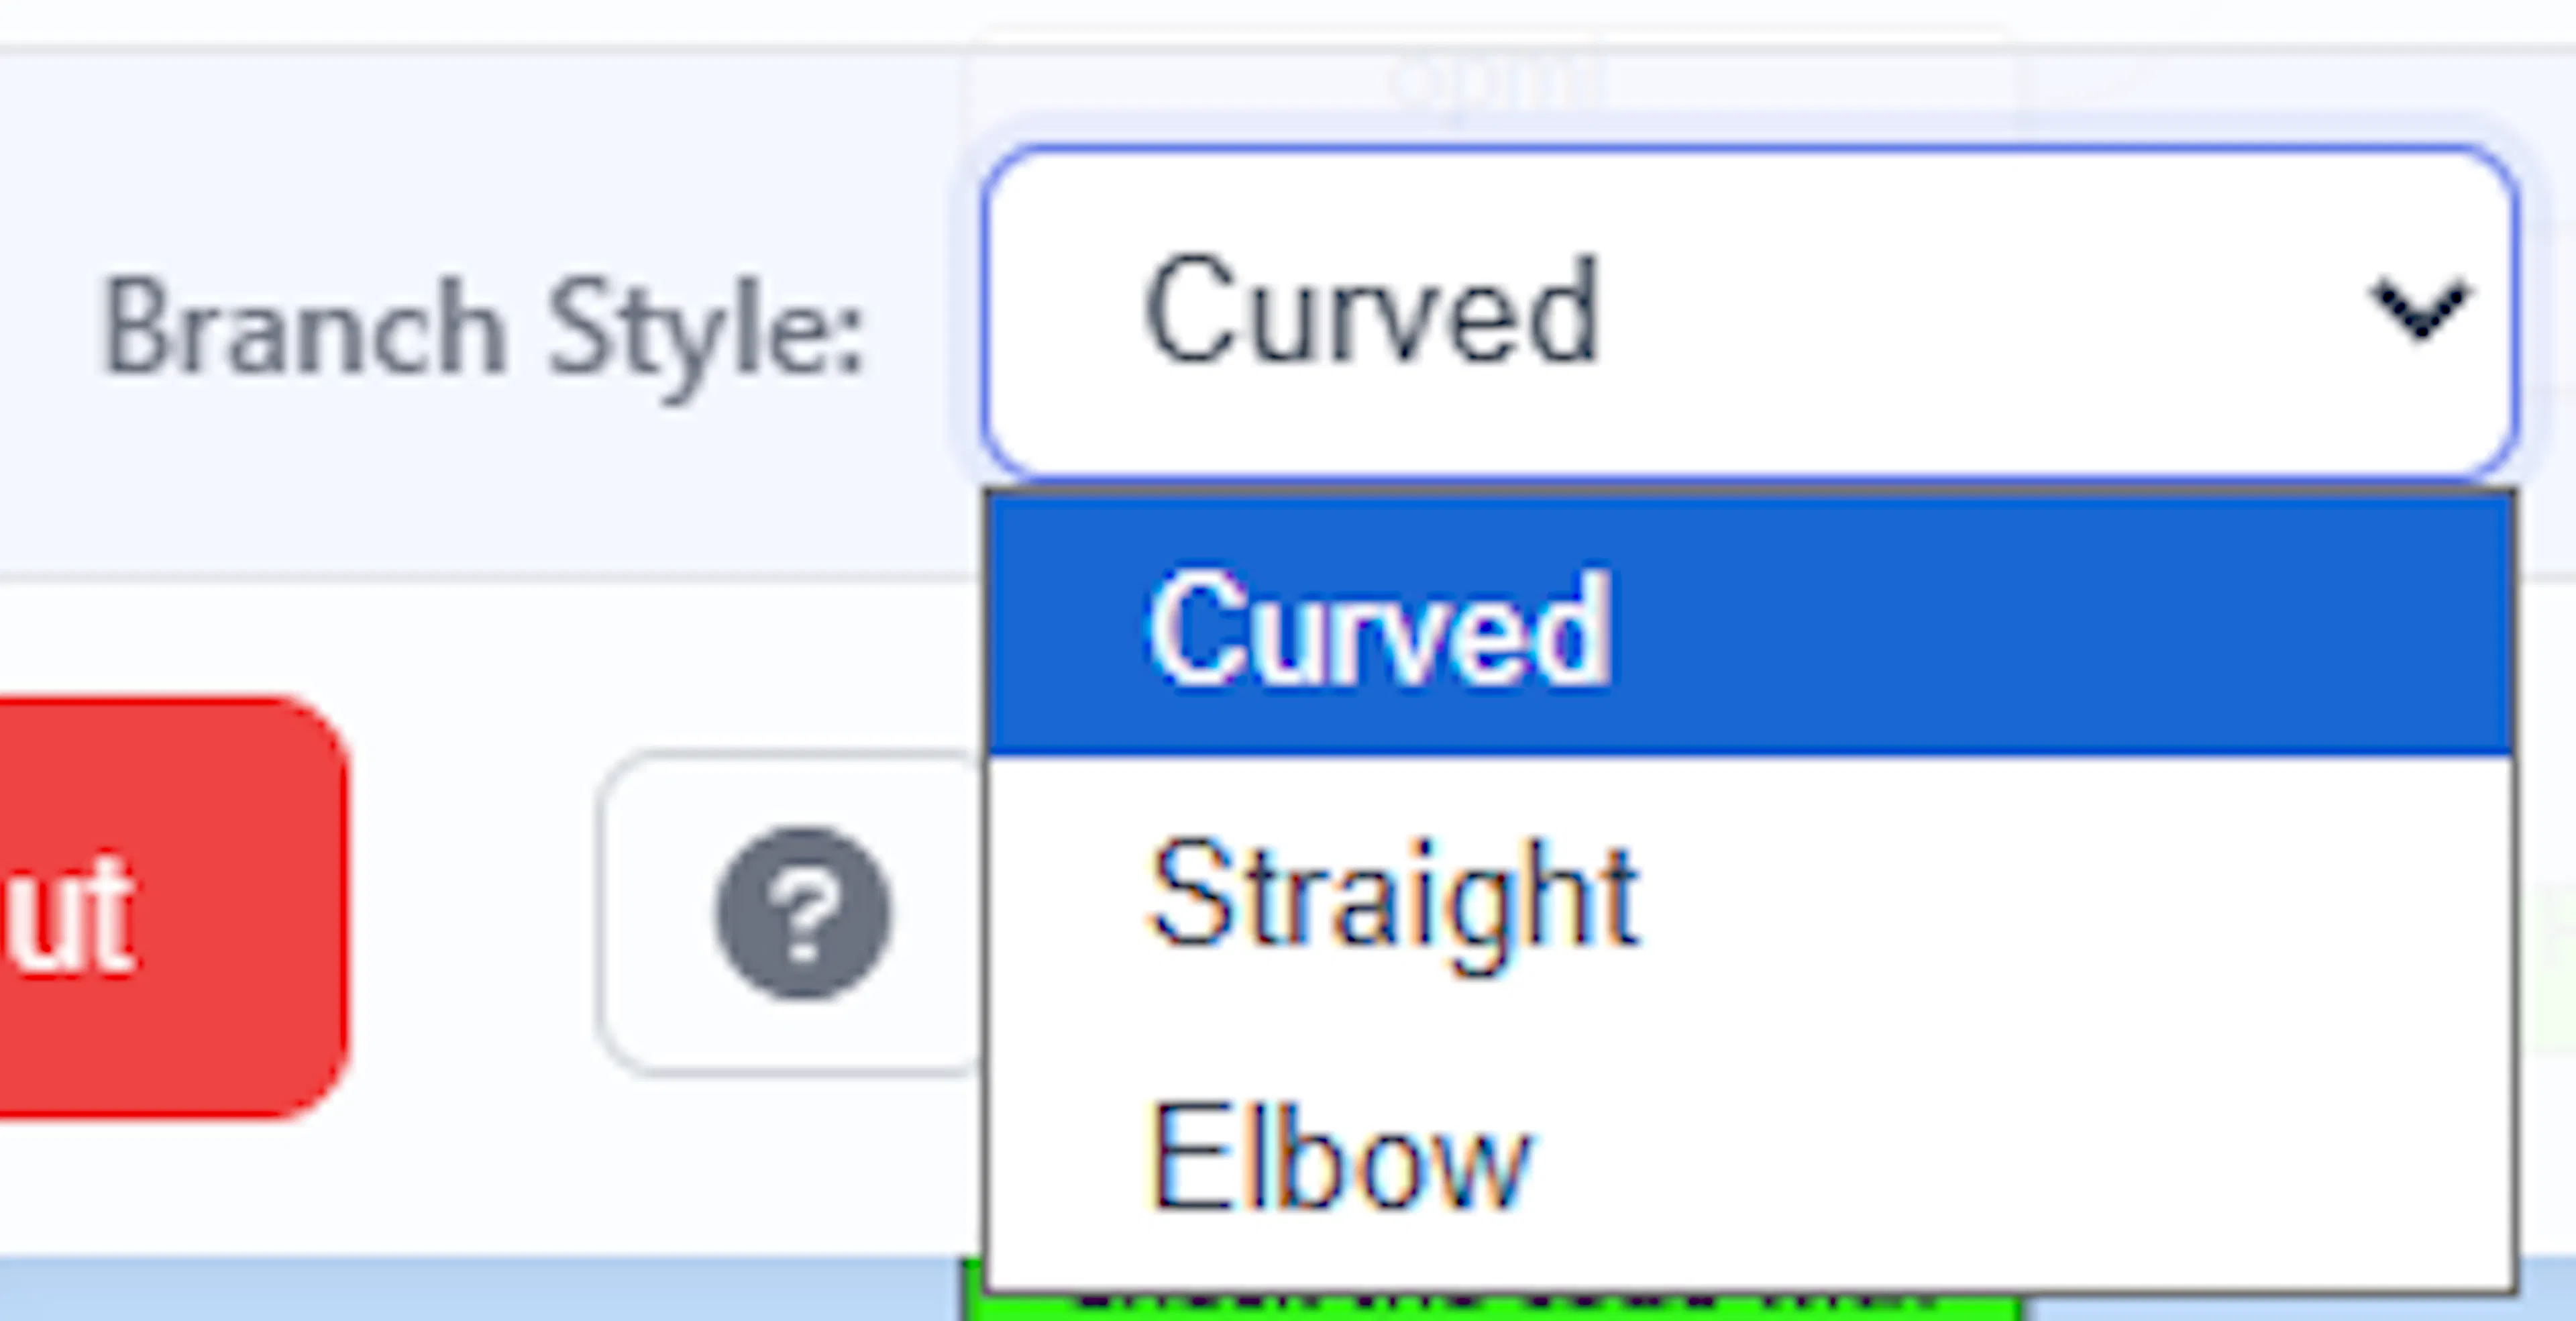
How to Change Branch Styles To modify the look of your structural tree, locate the Branch Style dropdown in the top input menu. Changing this setting immediately redraws the entire map using one of three routing algorithms:
-
Curved (Default): Draws smooth, bump-like curves that extend organically from the edges of your parent nodes to their children.
-
Straight: Draws direct, linear diagonal lines connecting the parent directly to the child without any curves.
-
Elbow: Creates structured, right-angle turns where the path travels horizontally first, and then drops vertically to meet the target node.
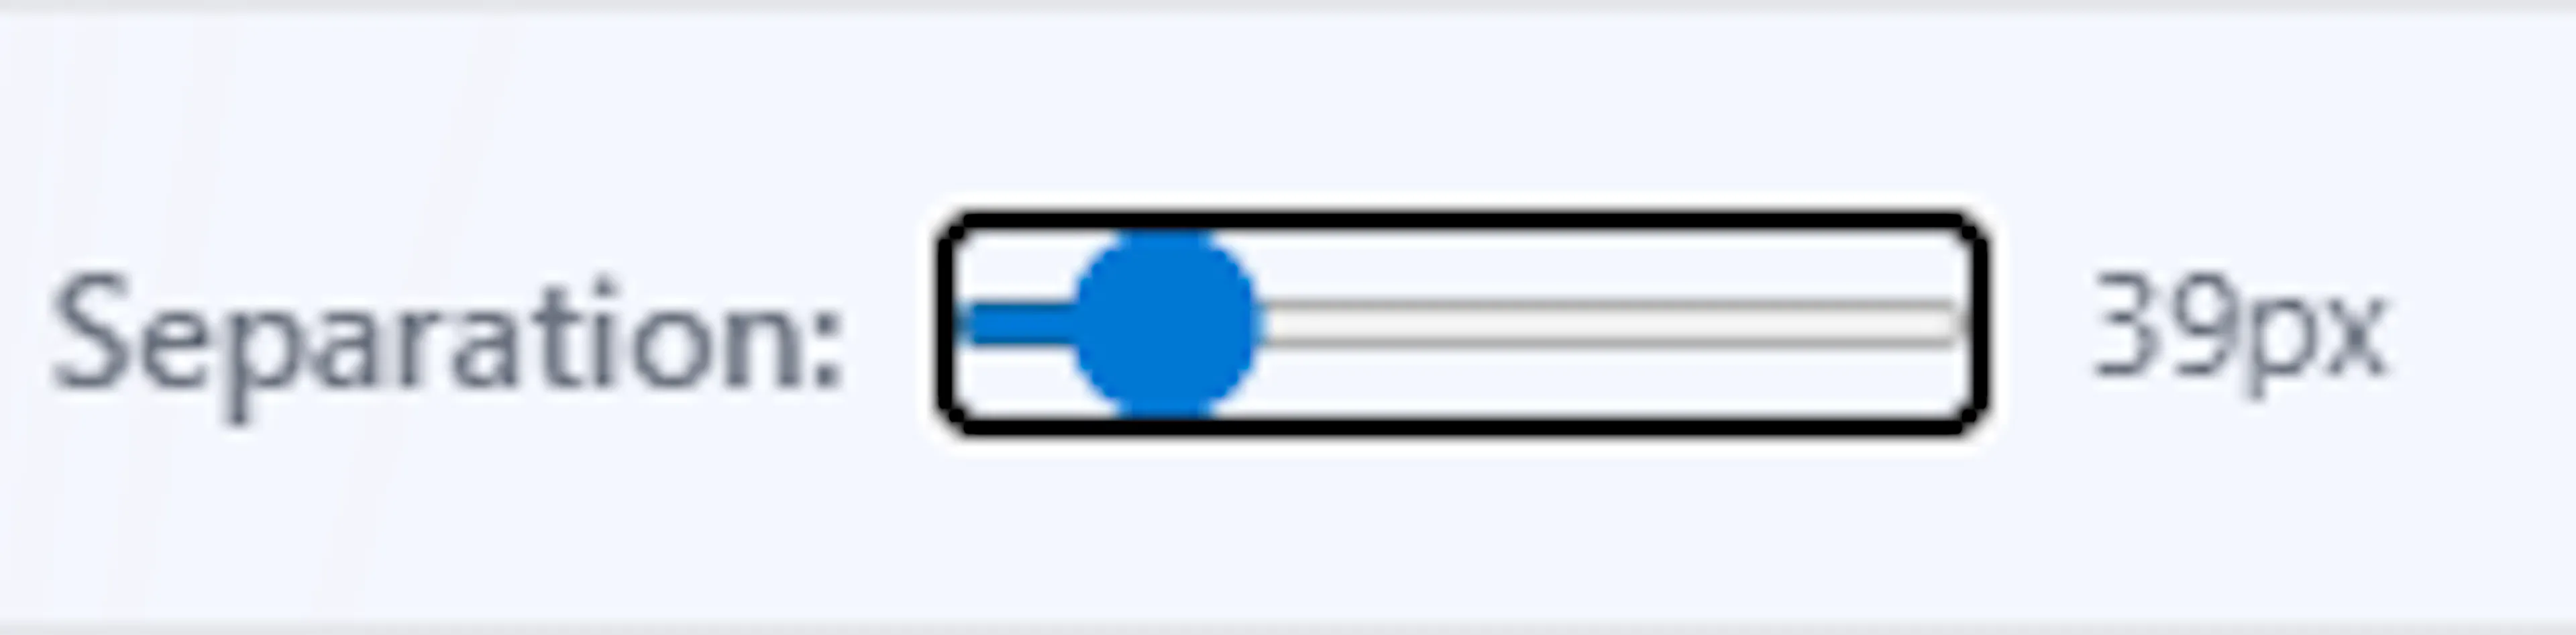
Adjusting Branch Separation Next to the style selector, you will find a Separation slider that controls the visual density of your branches.
-
Auto-Adjustment: By default, Mind Dump's layout engine dynamically calculates the optimal vertical separation between sibling branches to prevent nodes from colliding. It automatically increases the separation multiplier if tasks have multi-line text or if you have icons enabled.
-
Manual Override: If you want to force your map to be more compact or more spread out, you can manually drag the Separation slider (which scales the value between 25px and 125px).
Note on Overrides: The moment you manually adjust this slider, the system will disable its automatic overlap-prevention calculations for that session, locking the separation to your exact manual preference.
Restructuring Your Mind Map: Drag and Drop (Alphabetical Sessions)
Mind Dump allows you to dynamically restructure your entire project hierarchy using intuitive drag-and-drop actions. Whether you are reordering primary categories or shifting subtasks between different branches, your map instantly adapts.
The drag-and-drop behaviour depends on which level of the map you are interacting with:
1. Root Task Repositioning (Alphabetical Sessions) In Alphabetical (or Hierarchy) sessions, you have full spatial control over your root tasks—the primary nodes that branch immediately outward from the central session node.
- Auto-Collapse for Precision: When you click and begin to drag a root task, the mind map will instantly collapse all deeper branches, temporarily displaying only the central node and your primary root tasks. This auto-collapse feature stabilises the view, allowing you to clearly see the available "insertion gaps" and accurately drop the node into a new position around the central hub.
- Creating New Hierarchies: If you do not want to just reorder the node, you can drag a root task and drop it directly onto another root node. This will instantly demote the dragged task, nesting it as a child (subtask) under the target node.
2. Deep Level Dragging (Moving Subtasks) You can also grab tasks from the secondary level or deeper to completely reorganise your tree's structure:
-
Promoting to a Root Task: If you have a deeply nested subtask that has grown in scope, you can drag it directly onto the central session node (or into empty canvas space) to instantly promote it to a primary root task.
-
Moving to a New Parent: You can drag any subtask and drop it onto any other task node on the map to create a new parent-child relationship.
-
Branches Travel Together: When you move a node, you do not have to move its children individually. If the task you are dragging has its own subtasks, all child nodes will travel with the parent node to the new destination.
How Colours Behave When Moving Mind Dump uses a smart cascading colour system that automatically adapts when you restructure your map.
-
Inherited Colours: By default, nodes inherit the branch colour of their parent. If you move a node that is inheriting its colour, it will automatically update and inherit the colour of its new parent node when dropped.
-
Independent Colours: If you have specifically applied a custom colour to a node (overriding its original parent's colour), that independent colour will travel with the node to its new location, and its children will continue to cascade that specific colour.
Dragging Tasks in Date-Centric Mind Maps
In Date-centric sessions, drag-and-drop operations are engineered to help you rapidly reschedule and reprioritise your work, rather than just restructuring a hierarchy. How a task behaves when dropped depends entirely on the type of node you drop it onto.
Rescheduling Tasks (Date Categories) To quickly change a task's deadline, you can drag any task node and drop it directly onto a primary date category (such as "Due Today," "This Week," or "Overdue"). The system will automatically update the task's due date to match that specific time bucket.
Reprioritising Tasks (Urgency Groups) To adjust both a task's deadline and its priority simultaneously, you can drop the task onto an urgency group ("Urgent," "Normal," or "Not Urgent") nested under a date category. The app will instantly update the task to reflect both the new due date and the new urgency level.
Dropping into Empty Categories (Ghost Nodes) If an urgency level does not currently contain any tasks, the mind map normally hides it to keep your view uncluttered. However, the moment you begin dragging a task across the screen, the system reveals these empty groups as dashed "ghost nodes". This ensures you always have a valid drop target if you need to move a task into a previously empty priority level.
Creating Subtasks and Date Inheritance You can drag a task directly onto another task node to create a parent-child relationship. In Date-centric maps, child tasks are strictly tied to their parents' schedules. Therefore, when you drop a task onto a new parent, the subtask will automatically inherit both the due date and the urgency level of that parent.
Note: For this drop to be valid, the target parent task must already have a due date assigned.
Promoting Subtasks to Standalone Tasks If you want to un-nest a subtask, simply drag it away from its parent and drop it onto any date category or priority group. The system will remove its parent connection, promoting it to a standalone root task, and update its schedule based on where you dropped it.
Visual Feedback During Dragging As you drag a task around the canvas, Mind Dump provides immediate colour-coded feedback to guide you:
-
Valid Targets: Nodes that can accept the drop will pulse with a green highlight and a green border.
-
Invalid Targets: Nodes that cannot accept the drop (such as dropping a task onto itself, or onto a parent task that lacks a due date) will pulse with a red highlight and display a "not-allowed" cursor.
Searching Your Mind Map
To quickly locate specific tasks within a large or complex project, Mind Dump provides a powerful Search and Filter panel located on the left side of the canvas.
Quick Access: To instantly jump to the search input field without reaching for your mouse, you can use a global keyboard shortcut. Pressing Alt+f (on Windows) or Option+f (on Mac) will immediately focus the search box and highlight any existing text, allowing you to begin typing right away.
How Search Works: The search feature evaluates task names and operates in two distinct visual modes depending on how you interact with it:
-
Dynamic Highlighting (Standard Mode): As you type your keyword into the search box, the mind map reacts instantly. It works in tandem with the filtering system to highlight tasks that contain your search query while actively dimming or hiding the non-matching branches around them, helping your specific results stand out within the broader context of the tree.
-
Focused Search Mode: If you want to completely isolate your results and remove all visual clutter, type your query and press the Enter key. This triggers "Focused Search Mode." The system will calculate all matching tasks and temporarily rebuild the mind map canvas to display only those specific search results. When this mode is active, a prominent banner will appear at the top of the screen indicating exactly how many search results are currently being shown. Note: Because the map's structure is temporarily altered, you cannot use the inline forms to create new tasks while in Focused Search Mode.
Exiting Search Results: When you are finished reviewing your isolated results and need to restore the full mind map view, you have three simple options:
-
Using the Keyboard: While the search box is focused, press the Escape key.
-
Using the Banner: Click the Show All button located directly on the "Showing search results" banner at the top of your canvas.
-
Clearing Filters: Click the Clear All Filters button at the bottom of the Search and Filter panel. This is a comprehensive action that will empty the search box text, remove any other active urgency or date filters, and exit focused mode simultaneously.
Note: If you use the Escape key or the "Show All" button to exit Focused Search Mode, the full map structure is restored, but the text remains in the search box. This means those specific tasks will remain dynamically highlighted on your canvas until you delete the search text.
Advanced Search: Using Custom Filters
When a simple keyword search isn't enough to isolate the specific tasks you need, Mind Dump provides a powerful Custom Filters system. By clicking the Add Custom Filters button in the Search and Filter panel, you can build specific, targeted rules to narrow down your visual workspace.
Building Rules and the "AND" Relationship In the Custom Filters modal, you can create up to five distinct filter rules simultaneously. You can filter your tasks across a variety of criteria, such as Due Date, Time Estimate, Completion Status, or any of your custom Dropdown fields.
When you apply multiple filter rules at the same time, the system uses strict AND logic. This means that for a task to be displayed on your filtered mind map, it must meet all of the active conditions simultaneously.
Filtering by Branch Color One of the most unique filter options is the ability to filter tasks by their visual color. If you select Node Color as your filter field, the interface will change to display a color swatch picker showing the exact colors currently used across your map.
-
You can set the operator to "is" or "is not" to include or exclude specific colours.
-
Because the colour filter evaluates the effective colour of a node, it will accurately find tasks that have inherited their colour from a parent branch.
-
You can even select the patterned "Uncoloured" swatch to specifically hunt down tasks that haven't been assigned a colour yet.
The "Search All Tasks" Checkbox (Important) At the top of the Custom Filters modal, you will find a checkbox labelled "Search all tasks (including nested)". Understanding how this toggle works is critical for getting accurate results:
-
By default (Unchecked): The filtering engine only evaluates your primary, root-level tasks. It will not look inside your branches.
-
When Checked: The engine performs a comprehensive deep search through your entire hierarchy, evaluating every single subtask.
If you ever apply a filter and do not get the results you expect, it is highly likely that your matching tasks are nested deeper inside the mind map. You simply need to open the filter modal and select the "Search all tasks" box. The system will then find those deep matches and automatically expand their parent nodes so you can see them on the canvas. Note that searching all tasks is more comprehensive but can be slightly slower on massive maps.
Clearing Your Filters Once you have finished working with your isolated tasks, you can easily clear your custom filters to restore your full mind map. You can do this in three ways:
-
Click the small, underlined Clear button on the blue "custom filters active" banner in the left panel.
-
Open the Custom Filters modal and click the Clear All Filters button at the bottom.
-
Click the global Clear All Filters button located at the very bottom of the main Search and Filter panel, which will also wipe out any text searches or priority filters you have active.
The Mind Map Menu Bar
The main menu bar is located at the top of the Mind Map view and houses the primary controls for customising your workspace.
Auto-Hide and Pinning To maximise your vertical screen space—which is crucial when navigating complex trees—the menu bar is designed to auto-hide by default. When you move your cursor away from the top of the screen, the menu will automatically slide out of view after a brief delay. To reveal it again, simply move your mouse back to the top edge of the window.
If you are working on a larger desktop monitor and find the auto-hiding distracting, you can lock the menu in place. Next to the "Back to Task Manager" link, click the Pin button. This pins the menu so it remains permanently expanded, providing a more pleasant, static interface when screen real estate is not an issue.
Link Legend Clicking the Link Legend button toggles a helpful reference panel in the bottom corner of your screen. This legend acts as a quick visual guide, explaining the different colours and dash patterns used for your custom link lines (such as the blue dashed line for "Relates to," the amber dotted line for "Depends on," or the red line for "Blocks").
Group By (Restructuring Your Data) The Group By dropdown is one of the most powerful tools in the menu, as it fundamentally changes how your mind map branches are generated.
-
Due Dates: If you are in a Date-centric session, you can group by "Due Dates" to organise your primary branches into time-based buckets like Overdue, Today, and This Week.
-
Ungrouped (Hierarchy): Selecting this strips away other groupings and organises your tasks purely by their direct parent-child relationships.
-
Custom Fields: Beyond standard dates and hierarchies, you can dynamically rebuild your entire mind map grouped by your Dropdown Custom Fields. Only active custom fields configured as "Dropdowns" will appear in this list. When you select a dropdown field, the app automatically generates a primary branch for every option available in that dropdown, plus a dedicated "Unset" branch to catch any tasks that do not have a value assigned yet.
Show Icons and Show Tooltips These two checkboxes allow you to quickly declutter your interface:
-
Show Icons: Unchecking this box will instantly hide all task emojis and large text box icons across your entire map, giving you a cleaner, text-only view.
-
Show Tooltips: Unchecking this box disables the hover tooltips that normally appear when you move your mouse over custom link lines (which typically display the link's title and hidden comments).
Centre & Zoom If you ever lose your place on the infinite canvas, you can click the Centre & Zoom button. The layout engine will instantly calculate the physical boundaries of your entire mind map and smoothly pan and scale the camera so that all of your data fits perfectly in the centre of your screen.
Exporting and Sharing Your Mind Map
When you need to share your workspace, back up your data, or use your mind map in another application, Mind Dump provides three dedicated export options located in the top menu bar.
1. Export (OPML File Download) The Export button allows you to download your mind map's underlying structural data as an OPML (.opml) file. OPML (Outline Processor Markup Language) is a standard text format widely supported by other mind mapping, outlining, and note-taking applications.
-
How it works: When you click Export, the app translates your visual tree into a nested text outline and immediately triggers a file download to your computer.
-
Smart Exporting: The export intelligently respects your current view and grouping settings. If you are in a Date-centric session, the outline will be grouped by Dates and Urgency levels. If you are in an Alphabetical session, it will export your pure parent-child hierarchy. Furthermore, if you currently focus on a specific task or category, the export will include only that focused section of the map.
2. Copy OPML The Copy OPML button performs the exact same data translation as the standard Export button, but instead of downloading a file, it copies the raw OPML text directly to your computer's clipboard.
- How to use it: Click the button, and it will briefly turn green and display "Copied!" to confirm the action. You can then immediately paste the structural data directly into a text editor, an email, or another outlining tool.
3. Export PDF If you want to capture the visual representation of your mind map rather than just its data, use the Export PDF button. This generates a high-quality visual snapshot of your entire canvas.
-
How it works: When clicked, the button will display "Generating..." while it processes the map. The system automatically calculates the physical boundaries of all your visible nodes, perfectly centres the view, and scales your mind map so that it fits within a single A4 Landscape page document.
-
What you get: It produces a file named
mindmap.pdfcontaining a clean, white-background image of your workspace. Because it captures whatever is currently on the screen, any search filters or focus modes you have active will be perfectly reflected in the final PDF.
Note: For extremely large and complex mind maps, the system will scale the map down to ensure everything fits on the single A4 page, which may result in smaller text in the exported document.